



Applies to: BI 4.2, 4.3, BI 2025 · Reading time: 9 min
In short. Yes, you can build a dashboard with Web Intelligence, and thousands of organisations do so every day. But Webi is a reporting tool, not a dashboard tool: you need to know what you can get natively (KPIs, charts, interactive filters, navigation between tabs), what stays limited (visuals, cross-filtering, mobile, off-platform sharing), and what the BI 2025 new elements or extensions fill in. This article gives the recipe, the limits, and the three approaches to move from a report to a real dashboard.
What a dashboard expects
A dashboard is not a report with charts. It fits on one screen, it shows a few key indicators before the detail, it lets you filter and click to explore, it adapts to screen size, and it is shared with readers who will never build anything. Each of these expectations translates in Webi into a native feature, a trick, or a gap.
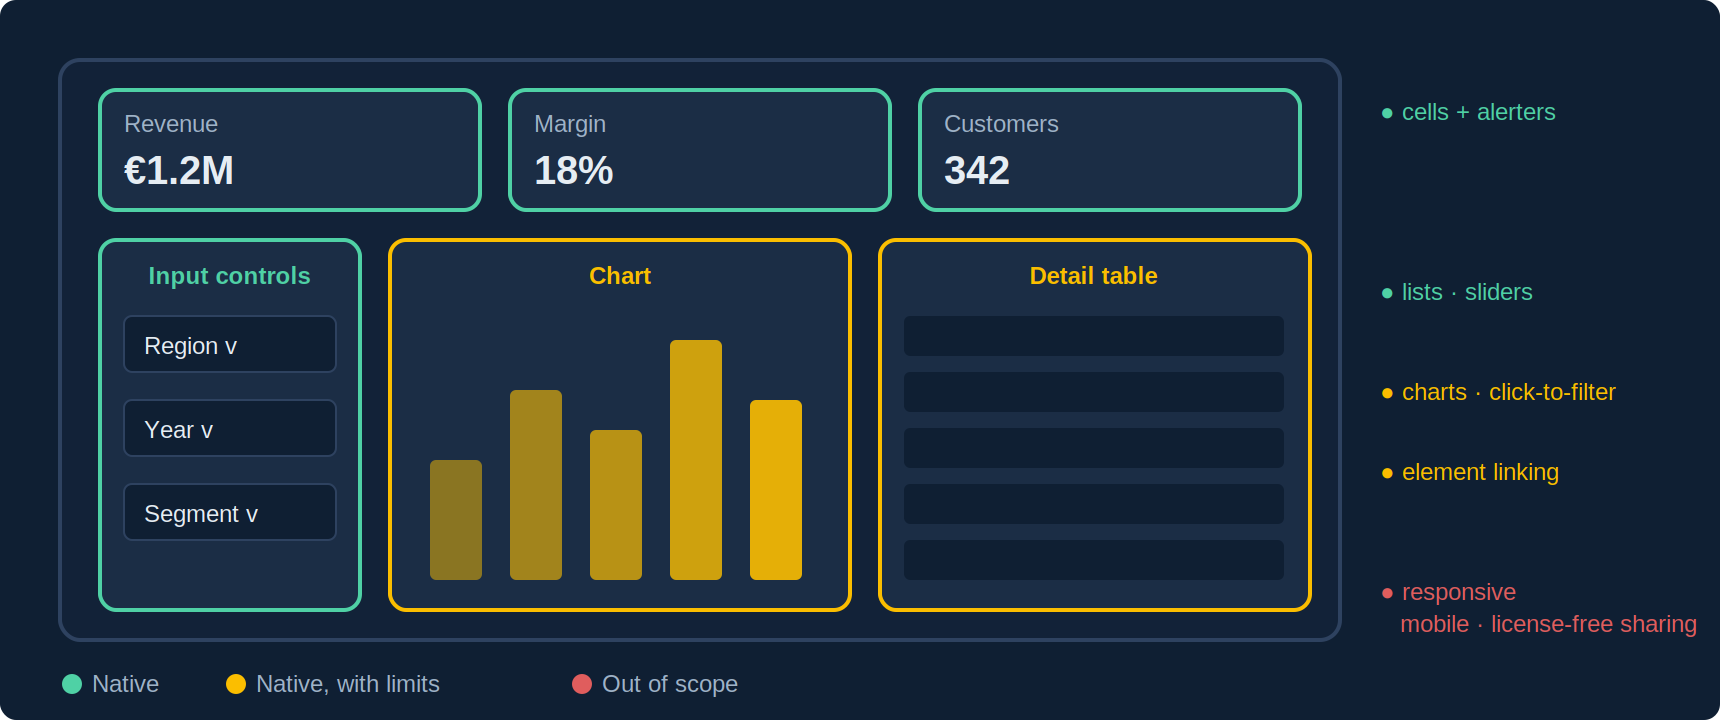
| Expectation | In native Webi | Level |
|---|---|---|
| Key indicators up top | Free cells with formulas, alerters, trend icons | Native |
| Interactive filters | Input controls (lists, check boxes, sliders, calendar), in-report filters in BI 2025 | Native |
| Click a chart to filter | Element linking: a table or chart acts as an input control | Native, with limits |
| Navigation between views | Tabs (reports), OpenDocument hyperlinks, Show/Hide buttons in BI 2025 | Native, with limits |
| Modern charts | Classic library; UI5 charts and micro-charts in BI 2025 | Limited |
| Responsive layout | Absolute positioning; predefined page formats in BI 2025 | Out of scope |
| Sharing with non-BO users | Static PDF; WIDX in BI 2025 (one report, first page) | Out of scope |
| Geographic maps | Basic choropleth maps (HERE base) | Limited |
The recipe for a good native Webi dashboard
- An aggregated query, not the detail: a dashboard shows totals. Returning detail to aggregate it in Webi is the first cause of slowness (see our performance article).
- A single tab for the main view, in “screen” mode rather than “page”, with a fixed width (1,280 px is a good compromise).
- A KPI strip at the top: free cells with the measure, the variance, and an alerter that colours or adds an arrow (see our alerters article).
- Input controls grouped on the left or top, assigned to every block on the tab, with dependencies (region → country) and a default value.
- Element linking for click-to-filter: a small region table or a bar chart defined as an input control filters the rest of the dashboard.
- Detail in secondary tabs, reached through hyperlinks passing the prompt or filter, rather than piling everything on one screen.
- An overnight schedule with instances served to readers, so opening is instant.
Where native stops
- Visuals: classic charts look dated; BI 2025’s UI5 charts are cleaner but remain report charts, with no advanced gauges, sankey, interactive treemap or heat map.
- Cross-filtering: element linking works one way (the source block filters the others), not in every direction as in a dashboard tool.
- Drill: drill mode exists, but it transforms the block rather than opening a view; it is rarely usable by an untrained reader.
- Mobile and responsive: layout is absolutely positioned; a dashboard designed for 1,280 px stays at 1,280 px.
- Sharing: a reader needs a BO session, hence a license, to open an interactive document. PDF freezes, WIDX only covers one report and its first page, with no sort or drill.
- Consolidation: a dashboard that must bring together several Webi documents has no native solution, short of merging everything into one document.
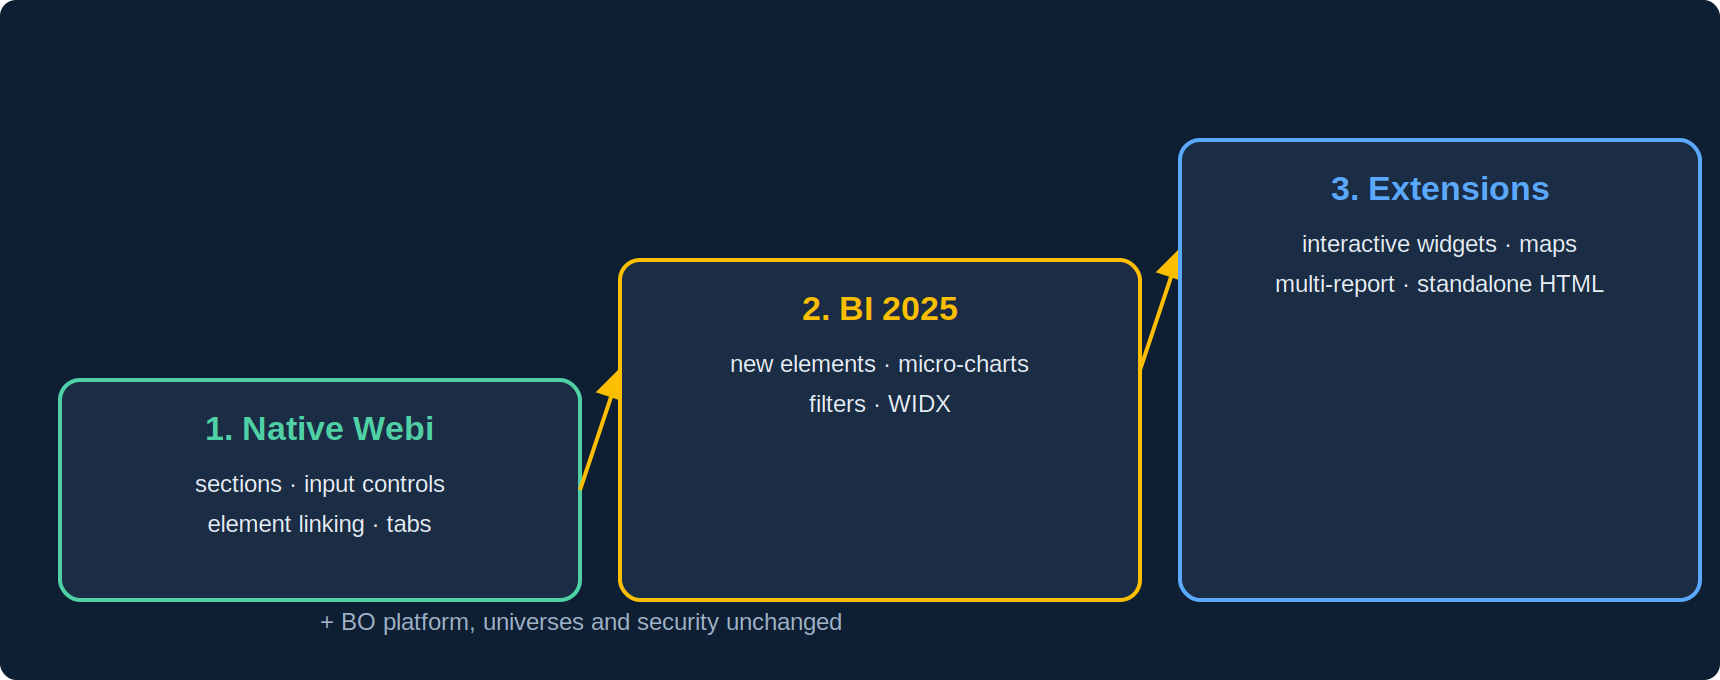
Three approaches to go further
1. Native Webi, well designed
The recipe above. Enough for an internal management dashboard, viewed by BO users, on a desktop screen. Cost: zero, apart from design time.
2. BI 2025 and the new elements
The scrollable table with micro-charts (bars, bullet, radial), in-report filters (date range, buttons), containers, the Show/Hide button and the CSS editor bring Webi closer to a real dashboard. The WIDX export allows off-platform sharing, within its current limits. Condition: rebuild the document with the new elements; classic ones gain nothing. See our version comparison.
3. Extensions on Webi
Extensions installed on the platform add to the existing Webi document what native does not do: a library of interactive visualisations (click-to-filter in every direction, drill, gauges, maps), assembling several reports into one dashboard, and a standalone, responsive HTML export viewable with no BO session or license. Universes, security and schedules remain BO’s; this is the scenario chosen by organisations that want the visuals without the migration project (see Migrate or modernise).
Frequently asked questions
Do I need SAP Analytics Cloud to build an SAP dashboard?
No. SAC is an excellent dashboard tool, but it is added to BO, it does not reuse Webi reports, and it requires a subscription. For an existing BO estate, native or extended Webi covers most needs.
Can a Webi dashboard be viewed on mobile?
Through the SAP BI Mobile app or the browser, yes, but with no automatic layout adaptation. For true responsiveness, you need a standalone HTML export.
How many blocks per tab?
Fewer than ten. Beyond that, rendering time and readability degrade; push detail to secondary tabs.
Are Dashboards (Xcelsius) and Design Studio still an option?
No, both have been removed from the platform. Dashboards built with them must be rebuilt, in Webi or with an extension. See our article on life after Lumira and Design Studio.
Sources and references
- SAP Help Portal — SAP BusinessObjects Web Intelligence User’s Guide (input controls, element linking, hyperlinks)
- Christian Ah-Soon (SAP), “SAP BI 2025: What’s New In Web Intelligence and Semantic Layer” (new elements, WIDX, page formats)
- SAP Community — SAP BusinessObjects BI Platform hub
- Need4Viz — “SAP BI 2025: New Features, Limitations and N4V Solutions”
- Need4Viz field experience in Webi dashboard design
👉 Discover Need4Viz and what we really bring to SAP Web Intelligence
Need4Viz extends SAP Web Intelligence with advanced dataviz, interactivity, automation and AI capabilities to transform your reports into real decision-making tools.
Discover Need4Viz