


Applies to: BI 4.2, 4.3, BI 2025 · Reading time: 8 min
In short. A report that shows everything draws attention to nothing. Web Intelligence offers two mechanisms to prioritise information: alerters (called conditional formatting rules in recent versions), which change a cell’s appearance when a condition is true, and rankings, which keep only the top or bottom N values of a dimension by a measure. The two combine: a Top 10 with negative variances in red is the most-read dashboard in any company.
Alerters: anatomy of a rule
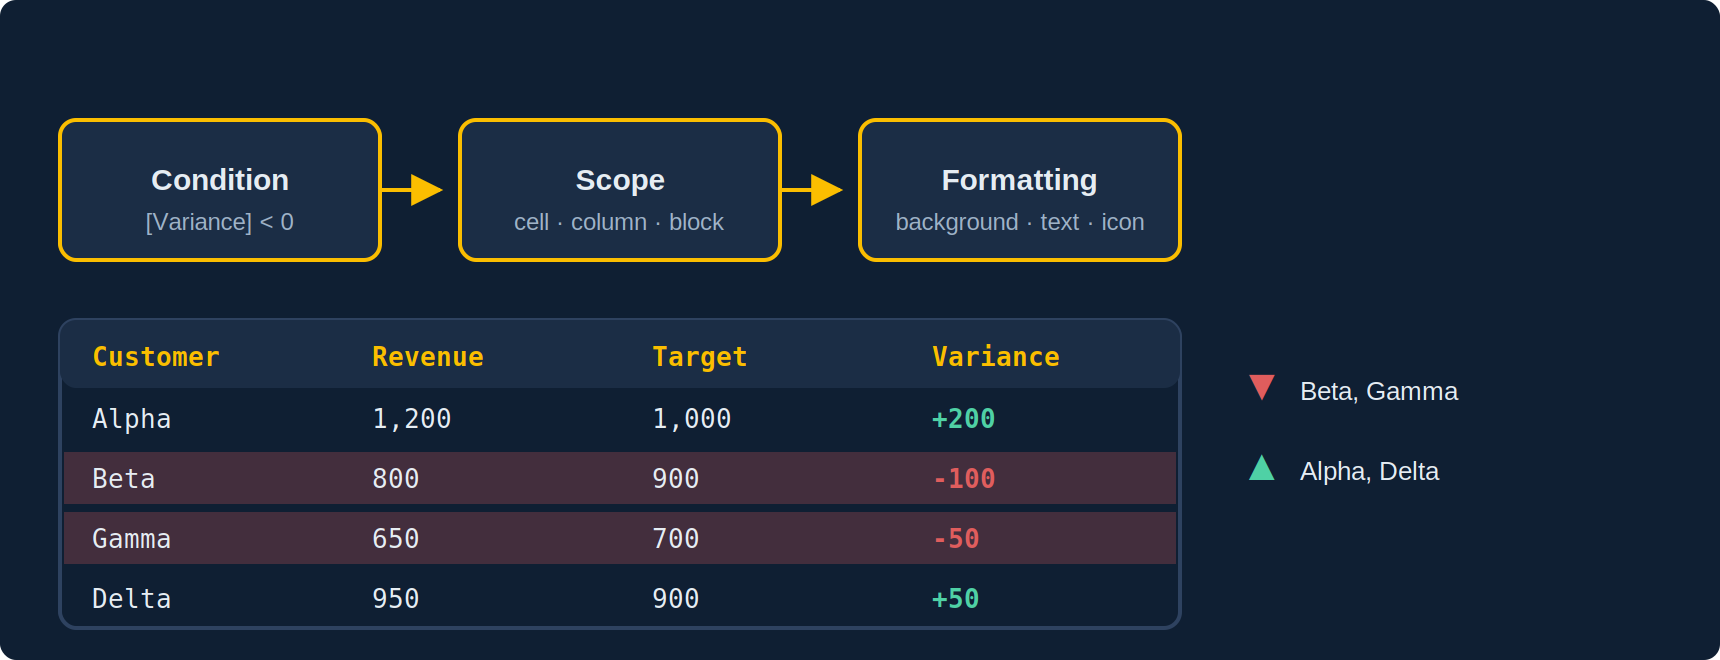
An alerter is created from the ribbon (Analysis → Conditional or Conditional formatting depending on the version) and has three parts:
- The condition: on an object (Variance less than 0), on the cell content, or on a free formula (
=[Margin] / [Revenue] < 0.1). A rule can hold several sub-conditions combined with AND/OR, and an alerter can hold several rules evaluated in order: the first true one applies. - The scope: the alerter applies to one or more cells, columns, or a whole block. The condition can use a different object than the one displayed: colour the Customer column when Variance is negative.
- The formatting: background colour, text colour and style, borders, and replacing the content with a text or an image (a red pictogram, an arrow). Content replacement lets you show “▲” or “▼” instead of a number.
Five uses that come up everywhere
| Need | Condition | Note |
|---|---|---|
| Negative variance in red | [Variance] < 0 |
The simplest case; apply to the whole row for readability |
| Traffic light on a rate | 3 rules: < 0.8 red, < 0.95 amber, else green |
Rule order matters: the first true one wins |
| Above average | [Revenue] > Average([Revenue] In Block) |
Calculation contexts apply to alerters just like variables |
| Parameterised threshold | [Margin] < UserResponse("Margin threshold") |
The threshold comes from a prompt, without editing the report |
| Icon instead of the number | [Trend] > 0 → replace with “▲” |
Keep the number in a neighbouring column; the icon alone does not survive every export |
Rankings: Top N and Bottom N
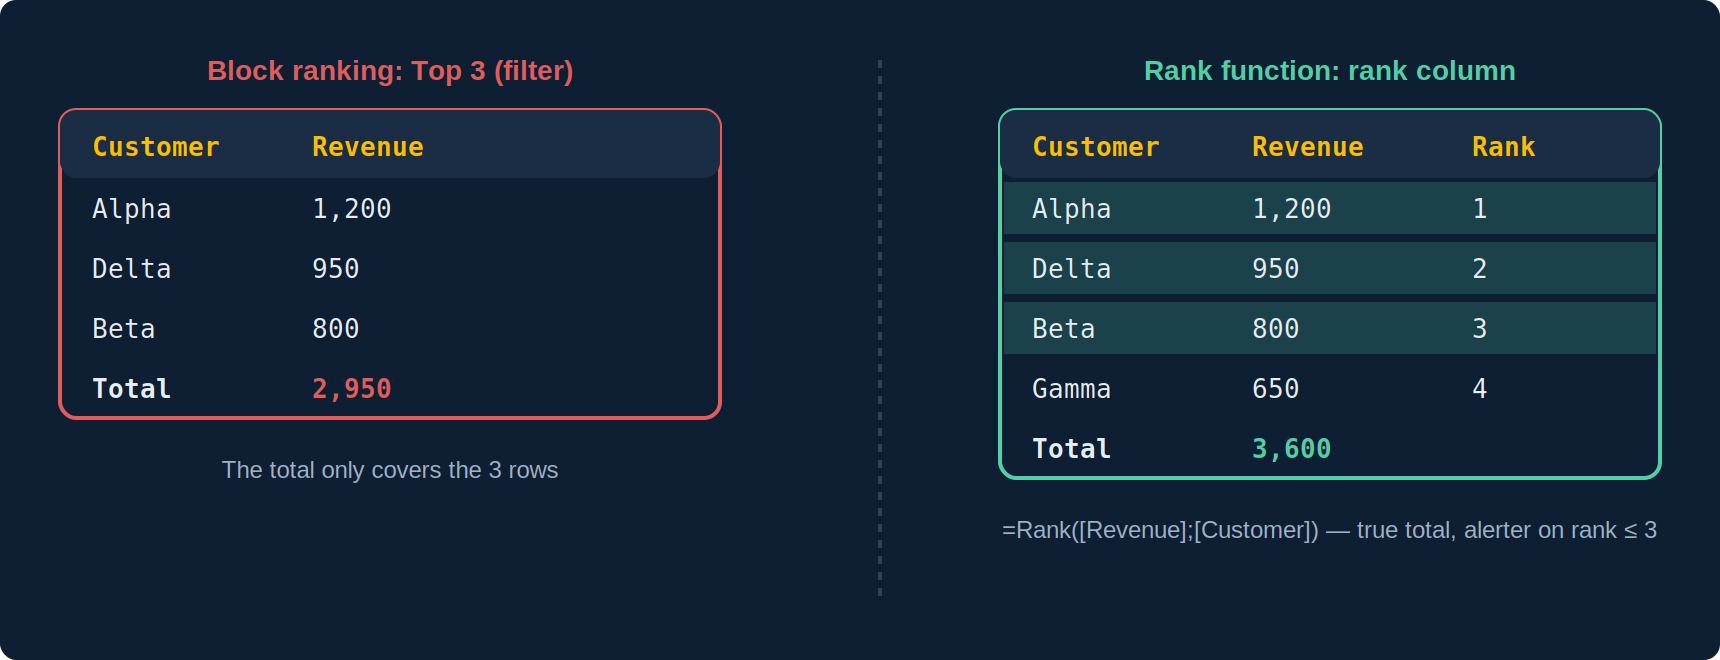
Two tools exist and are often confused:
- Block ranking (Analysis → Ranking): it filters the table to the top or bottom N values of a dimension by a measure, with a calculation mode (count, percentage, cumulative sum). It can be applied per section or per break (the Top 5 of each region). It is a filter: block totals only cover the rows kept.
- The
Rankfunction: it computes a rank in a variable, without filtering.=Rank([Revenue];[Customer])gives each customer’s rank by revenue; a third argument (Top/Bottom) sets the direction, and a reset context (=Rank([Revenue];[Customer];Top;([Region]))) restarts the ranking in each region. You then combine it with a report filter ([Rank] <= 10) or an alerter.
The “Others” total
The classic need: a Top 10 with an “Others” row gathering the rest, so the block total is the true total. Block ranking does not do it natively. The fix is a variable: =If([Rank] <= 10; [Customer]; "Others") used as the table’s dimension, with revenue summed on it.
NoFilter: computing over filtered rows
A ranking or a report filter hides rows, and the block’s calculations no longer see them. To show the Top 10’s share of the real total, the NoFilter function ignores report filters: =Sum([Revenue]) / NoFilter(Sum([Revenue] In Report)). It only applies to report filters, never to query filters.
Pitfalls and limits
| Symptom | Cause | Fix |
|---|---|---|
| The alerter colours the wrong row | The condition is evaluated in a different context than the cell (measure aggregated elsewhere) | Write the condition with an explicit context, test on a flat table |
| The total no longer matches the Top N | Ranking is a filter; the total covers the remaining rows | “Others” row via a variable, or NoFilter |
| Ties ranked oddly | Rank gives equal values the same rank and skips the next |
Add a tie-breaking dimension to the ranked measure |
| The report slows down | Dozens of formula alerters on large blocks, re-evaluated on every interaction | Compute the state in a variable, one alerter on that variable |
| Colours vanish on export | Some formats (CSV, text) ignore formatting; replacement icons do not survive everywhere | Keep the numeric value in a column, test the target export |
| No alerter on a chart | Conditional rules apply to cells, not to series | Chart’s conditional palette (limited), or a category variable used as legend |
Best practices
- Three colours per report at most, always with the same meaning (red = action required). A multicoloured report signals nothing.
- Name alerters after their business rule (“Margin under threshold”), not “Alerter 1”: they are reusable across the document.
- Centralise the logic in a state variable (
=If([Variance] < 0; "KO"; If([Variance] < [Threshold]; "Watch"; "OK"))) and set a single alerter on it: readable, fast, editable in one place. - Think of colour-blind readers: pair a symbol or text with the colour.
- A ranking per section rather than a report per region: fewer tabs, one filter.
Frequently asked questions
Are alerters and conditional formatting the same thing?
Yes. “Alerter” is the historical term, “conditional formatting rule” the term in recent interfaces; the mechanics are identical.
Can an alerter apply to a whole row?
Yes, by selecting every cell in the row (or the block) before applying the rule, with the condition on a single column.
Do block ranking and Rank give the same Top N?
Generally yes, but block ranking handles ties and calculation modes (percentage, cumulative) differently. For an auditable result, prefer Rank in a visible variable.
Are alerters kept in a scheduled instance?
Yes, in Webi, PDF and Excel formats. They are lost in CSV and text.
Sources and references
- SAP Help Portal — SAP BusinessObjects Web Intelligence User’s Guide (BI 4.3 / 2025)
- SAP Community — SAP BusinessObjects BI Platform hub
- Need4Viz field experience on BI 4.1 to BI 2025 deployments
👉 Discover Need4Viz and what we really bring to SAP Web Intelligence
Need4Viz extends SAP Web Intelligence with advanced dataviz, interactivity, automation and AI capabilities to transform your reports into real decision-making tools.
Discover Need4Viz