


Applies to: BI 4.2, 4.3, BI 2025 · Reading time: 9 min
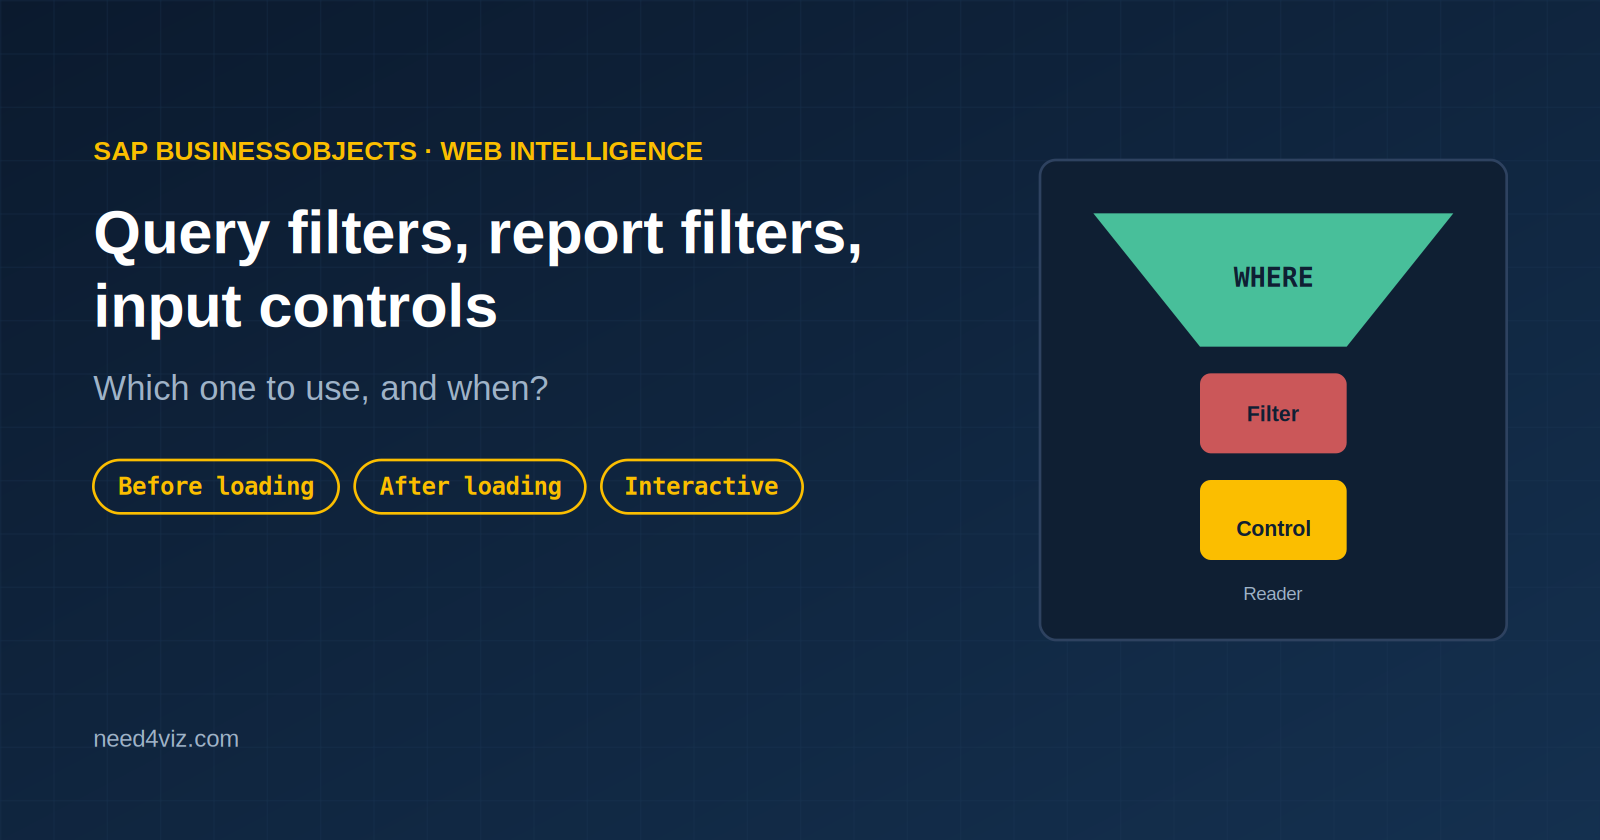
In short. Web Intelligence offers three ways to filter data, and they don’t act at the same moment. A query filter acts before loading: it becomes a WHERE clause and reduces the rows returned by the database. A report filter acts after: it hides rows already loaded, in a report, a section or a block. An input control is an interactive report filter, driven by the reader. Picking the wrong mechanism costs performance, readability or the correctness of totals.

Comparison table
| Query filter | Report filter | Input control | |
|---|---|---|---|
| When | Before loading (SQL) | After loading | After loading |
| Scope | The whole document (the data provider) | Report, section or block | One or more blocks, or the whole report |
| Data volume | Reduced | Unchanged | Unchanged |
| Interactive for the reader | Through a prompt (requires a refresh) | No (except the filter bar) | Yes, instant |
| Effect on totals | Totals only see filtered data | Block totals follow the filter; In Report ignores block filters |
Same as report filter |
| Performance cost | Lowest | Block recalculation | Recalculation on every click |
| Use case | Scope: fiscal year, entity, status | Fixed views: “top 10”, one tab per country | Reader-driven exploration |
The decision rule in one sentence
Anything that will never be displayed goes in a query filter; anything that presents the same data differently goes in a report filter; anything the reader must be able to change without refreshing goes in an input control. When the reader must change the scope themselves but the full volume is too large to load, the answer is a prompt on a query filter, not an input control.

Query filters: what you need to know
- Prompts: a query filter whose value is asked at refresh time. They can be mandatory or optional, single or multi-value, with a list of values or free entry. An optional prompt left empty is simply ignored in the SQL.
- Universe predefined filters: conditions written once in the universe (“Current fiscal year”, “Active customers”) and reusable everywhere. They guarantee a single definition of the scope across the organisation.
- Subqueries and “results from another query”: to filter a query by the values of another (customers who ordered last year). Powerful, but every level adds a SQL pass.
- AND / OR combinations: nesting is done by drag and drop in the panel; always check the generated SQL (View Script), a misplaced bracket silently changes the scope.
- Filtering on a measure: possible, but the filter becomes a
HAVINGclause applied at the query’s aggregation level, not the displayed block’s. “Revenue > 10,000” does not mean the same thing per customer and per order line.
Report filters: the three levels
A report filter can be set on the whole report (every block in the tab), on a section, or on a single block. Levels stack as AND: a block filtered on “France” in a report filtered on “2026” only shows France 2026. Two forms exist:
- The filter bar (simple filters): quick to set, visible to the reader, one value at a time.
- Custom filters: full operators (between, not equal to, matches pattern), multiple values, filters on variables. This is where you write “top 10” or “variance < 0”.
Important point: a report filter does not change the calculation context. Sum([Revenue] In Report) still sees every loaded row, even in a filtered block, which is exactly what you need to compute a share of total. To make a calculation respect a filter, use the Where operator in the formula (see our calculation contexts guide).
Input controls: the reader-side filter
- Types: drop-down list, radio buttons, check boxes, simple or double slider (for measures), calendar. Pick according to the number of values and the object type.
- Assignment: a control applies to one block, several chosen blocks, or the whole report. This is the number one source of errors: a control that filters only the table, not the chart next to it.
- Dependencies: a control can depend on another (region → country → city), which narrows the lists to consistent values.
- Block-based controls: a table or a chart can itself act as a control (“clicking a bar filters the rest of the report”). This is what brings Webi closest to a native dashboard.
- Default values and “All”: define them explicitly; a control with no default shows everything, which hides its existence from the reader.
Five classic pitfalls
| Symptom | Cause | Fix |
|---|---|---|
| The report is slow though it only shows 200 rows | The scope is set as a report filter, everything is loaded | Move the filter into the query |
| The share of total changes when the block is filtered | The denominator is computed in the block context | Use In Report or In Block as needed |
| The input control does not filter the chart | Assignment limited to the table | Edit the control’s dependencies |
| Nothing shows after a filter | Stacked report + section + block filters are incompatible | Open the filter panel, check each level |
| The document refreshes on every open without asking anything | Optional prompt + “refresh on open” | Make the prompt mandatory, or disable refresh on open |
Frequently asked questions
Can I combine an input control and a query filter on the same object?
Yes. The query filter sets the maximum scope (say, the last three fiscal years), the input control lets the reader pick which loaded year to display.
Can a report filter apply to a measure?
Yes, and it applies to the value aggregated in the block: “Revenue > 10,000” on a table by customer keeps customers whose total exceeds 10,000. The same filter in the query would apply to the SQL aggregation, often a different one.
Are input controls kept when saving?
The definition yes; the current selection depends on the save option and the version. Set a default value if the report must always open on the same view.
Does a report filter change the result of Sum([Revenue] In Report)?
Not for a block or section filter; yes for a filter at the whole-report level, which defines the “Report” scope.
Sources and references
- SAP Help Portal — SAP BusinessObjects Web Intelligence User’s Guide (BI 4.3 / 2025)
- SAP Community — SAP BusinessObjects BI Platform hub
- Need4Viz field experience on BI 4.1 to BI 2025 deployments
- Christian Ah-Soon (SAP), “SAP BI 2025: What’s New In Web Intelligence and Semantic Layer”, SAP Community, March 2025
👉 Discover Need4Viz and what we really bring to SAP Web Intelligence
Need4Viz extends SAP Web Intelligence with advanced dataviz, interactivity, automation and AI capabilities to transform your reports into real decision-making tools.
Discover Need4Viz