



Applies to: BI 4.2, 4.3, BI 2025 · Reading time: 10 min
In short. A slow Web Intelligence report almost always has one dominant cause, located in one of four layers: the query (generated SQL, volume returned), the universe (joins, aggregates, security), the document (formulas, blocks, merges) or the platform (Webi servers, scheduling, cache). Optimising before identifying the layer wastes time. This guide starts with the diagnostic method, then gives 12 levers sorted by layer and impact.
Step 0: where does the time go?
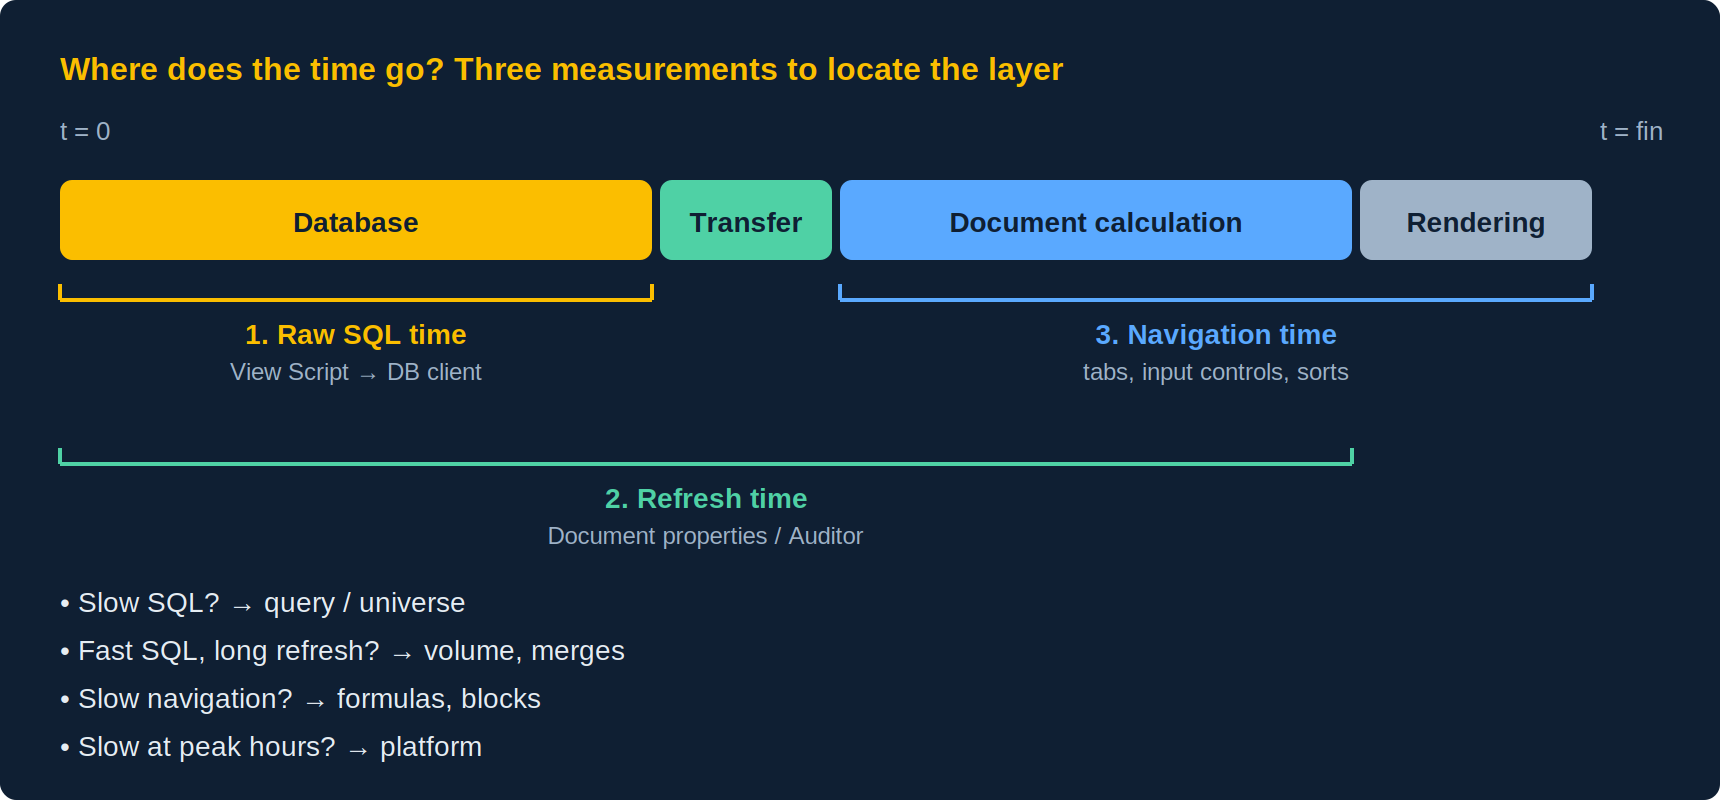
Three measurements locate the problem in 90% of cases:
- Raw SQL time: in the query panel, View Script, then run that SQL in a database client (DBeaver, SQL Developer, SSMS). Note the time and the row count.
- Refresh time: document properties, last refresh duration, or Auditor if enabled.
- Navigation time: switching tabs, applying an input control, sorting. If that is where it lags, the query is not the culprit.
| Symptom | Likely layer | Levers |
|---|---|---|
| SQL slow in the database client | Query / universe | 1 to 5 |
| SQL fast, refresh long | Volume transferred, merges, formulas | 2, 5, 6, 8 |
| Refresh fine, navigation slow | Document | 6, 7, 9 |
| Fast alone, slow at peak hours | Platform | 10, 11, 12 |
| Slow only for some users | Security / universe restrictions | 4, 12 |
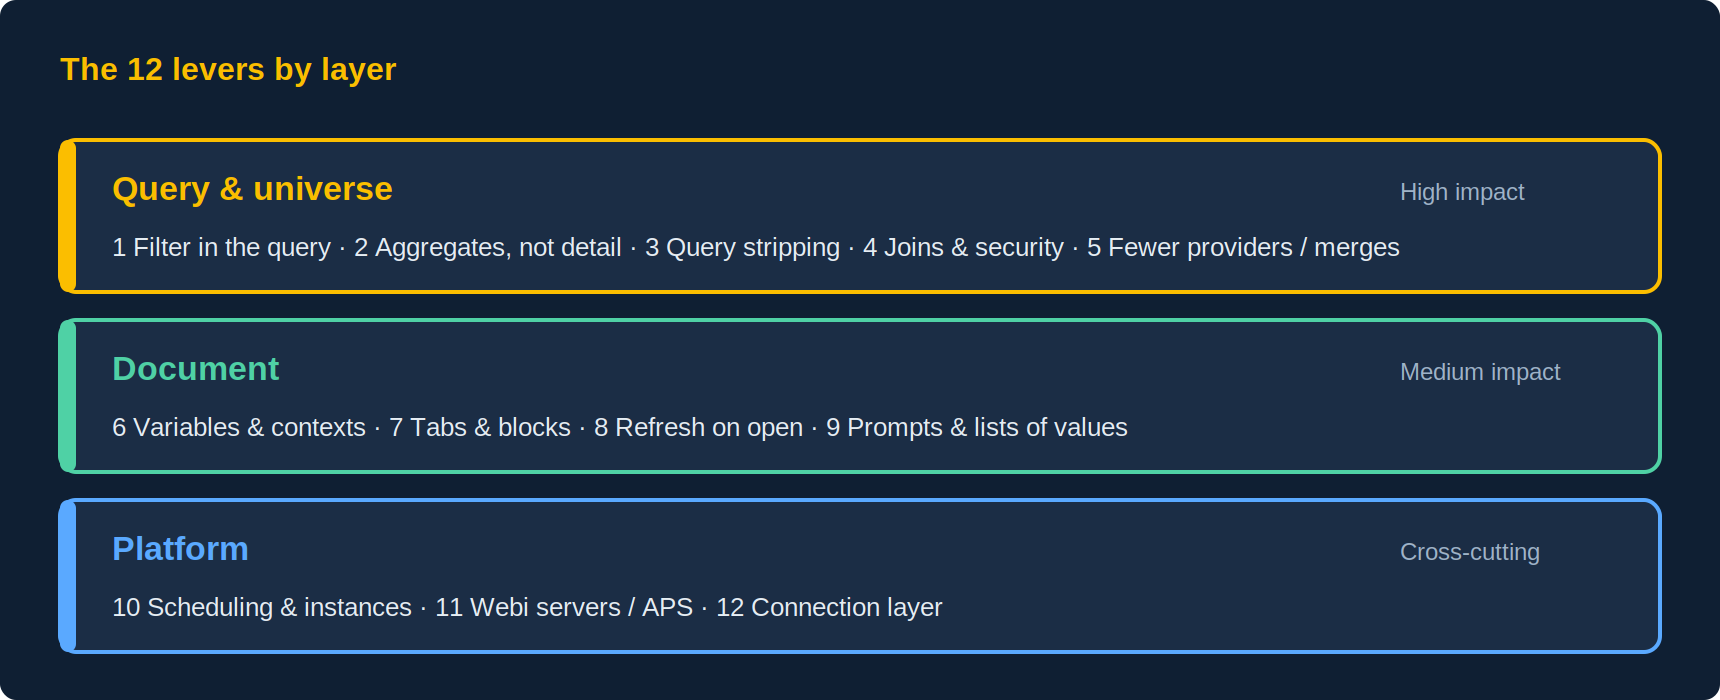
Query and universe layer
1. Filter in the query, not in the report
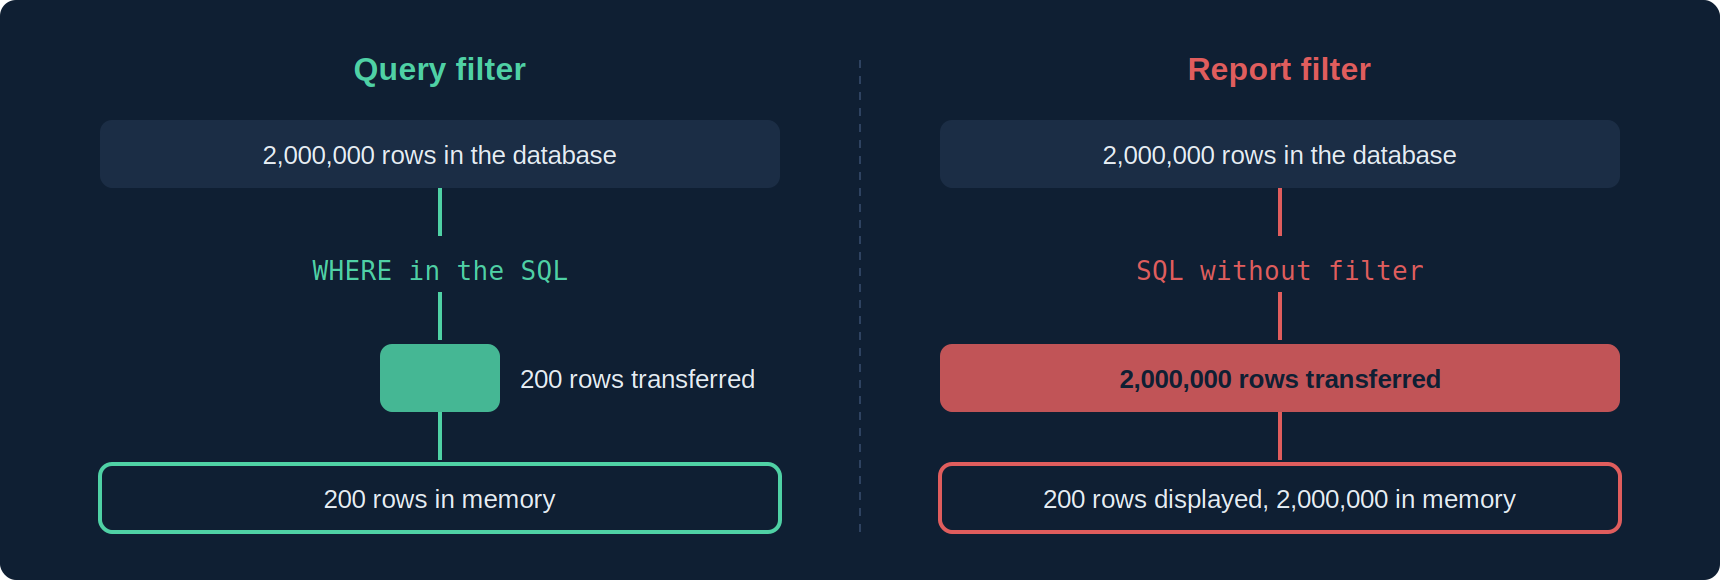
A query filter becomes a WHERE clause: fewer rows read, transferred and stored. A report filter hides rows already loaded in the document cube. Simple rule: anything that will never be displayed must be filtered in the query, through prompts if the scope varies.
2. Return aggregates, not detail
The first symptom of a badly designed report is a row count far above the number of rows displayed. If the report shows 200 rows per month and region, the query should not return 2 million transactions. Use the universe’s aggregated measures, and if the need is recurring, an aggregate table with aggregate awareness.
3. Enable query stripping
Document properties, Enable query stripping: objects present in the query but used nowhere in the reports are removed from the generated SQL. Very effective on BW/BEx, also useful on relational sources since BI 4.x. Ideal for “catch-all” documents enriched over the years.
4. Audit universe joins and security
Look at the generated SQL: loop joins resolved by heavy contexts, dimension tables joined with no object selected, access restrictions (security profiles) adding subqueries. Shortcut joins, index awareness (filtering on the key rather than the label) and clean contexts often cut SQL time in half without touching the report.
5. Limit data providers and merges
Every query is a round trip to the database and one more cube in memory; every merged dimension forces a row-by-row synchronisation. Three queries merged on a high-cardinality dimension (customer, product) are the classic cause of documents that “take 20 seconds on every click”. Whenever possible, a single query on a view or a consolidated fact table beats merging.
Document layer
6. Simplify variables and calculation contexts
Variables nested several levels deep, ForEach contexts on high-cardinality dimensions and string functions (Match, Substr, Pos) applied row by row are recomputed on every interaction. Whatever can be computed in the universe or the database should be. For the rest, prefer explicit In contexts, more predictable and faster to evaluate (see our calculation contexts guide).
7. Reduce tabs and blocks
All reports (tabs) in a document are computed on refresh, including those nobody opens, and hidden blocks are too. A document with 15 tabs and 80 blocks is a document with 15 reports. Remove orphan tabs, merge redundant blocks, and avoid tables of tens of thousands of rows: Webi is not an export tool.
8. Disable refresh on open when it is not needed
If data changes once a day, a document that refreshes on every open hits the database for nothing. Serve the latest scheduled instance instead (lever 10). Refresh on open is justified for near-real-time reports or reports with mandatory prompts.
9. Lighten prompts and lists of values
A prompt on an object whose list of values has 500,000 entries is slow before the query even starts. Use cascading lists of values, custom lists (static or based on a reference table) and, in the universe, disable automatic LOV refresh when it is not needed.
Platform layer
10. Schedule heavy reports and serve instances
The most profitable lever for management reports: schedule them overnight and distribute the instances. Users open an already-computed document, the server is not hit at peak hours, and neither is the database. Publications additionally allow personalised distribution per recipient.
11. Size and tune the Webi servers
On the Web Intelligence Processing Server: maximum connections, document cache size, maximum memory per process. On the APS: split services (DSL Bridge for BW, Visualization) rather than one monolithic APS. SAP’s sizing guide gives the orders of magnitude; an oversized server never compensates for a badly designed document, but an undersized one penalises even the good ones.
12. Check the connection layer
Driver (JDBC is often faster than ODBC on large volumes), array fetch size (the default is often too low for large result sets), connection pooling, and network latency between the Webi servers and the database. These settings are invisible to report designers, but they apply to every document at once.
Quick checklist before putting a report into production
- The number of rows returned is of the same order as the number of rows displayed.
- No report filter could have been a query filter.
- Query stripping enabled, refresh on open justified.
- A single query, or merges on low-cardinality dimensions only.
- No more than two levels of nested variables.
- No unused tab or block.
- Heavy, recurring reports are scheduled.
Frequently asked questions
How do I know whether the slowness comes from the database or from Webi?
Run the generated SQL in a database client. If it is as slow as the refresh, the problem is on the query/database side. If it is fast, it is in the document or on the Webi server.
Is a query filter really faster than a report filter?
Yes, almost always: it reduces the rows read and transferred, whereas a report filter only hides rows already loaded.
What is query stripping?
A document option that removes unused objects from the SQL. Very effective on BW/BEx, also available on relational sources.
Should I add memory to the Webi server?
Only after fixing the query and the document. Otherwise you hide the problem and meet it again on the next report.
Are Webi dashboards necessarily slow?
No, but a Webi dashboard consumes one server session per user per open. For wide distribution, it is often more efficient to publish a standalone HTML version, computed once and served with no load on the platform.
Sources and references
- SAP Help Portal — SAP BusinessObjects Web Intelligence User’s Guide (BI 4.3 / 2025)
- SAP Community — SAP BusinessObjects BI Platform hub
- Need4Viz field experience on BI 4.1 to BI 2025 deployments
- SAP Help Portal — Information Design Tool User Guide
- SAP Help Portal — SAP BusinessObjects BI Platform Administrator Guide
👉 Discover Need4Viz and what we really bring to SAP Web Intelligence
Need4Viz extends SAP Web Intelligence with advanced dataviz, interactivity, automation and AI capabilities to transform your reports into real decision-making tools.
Discover Need4Viz