N4V FOR WEBI: the ultimate upgrade for Web Intelligence!
Transform SAP Webi into one of the most comprehensive and versatile DataViz solutions on the market. Join the revolution!
The N4V FOR WEBI extension brings powerful modern charts, advanced interactivity, custom geographic mapping, data analysis capabilities, and unlimited mashup through HTML/PNG exports to intra/extranet, at no extra cost!
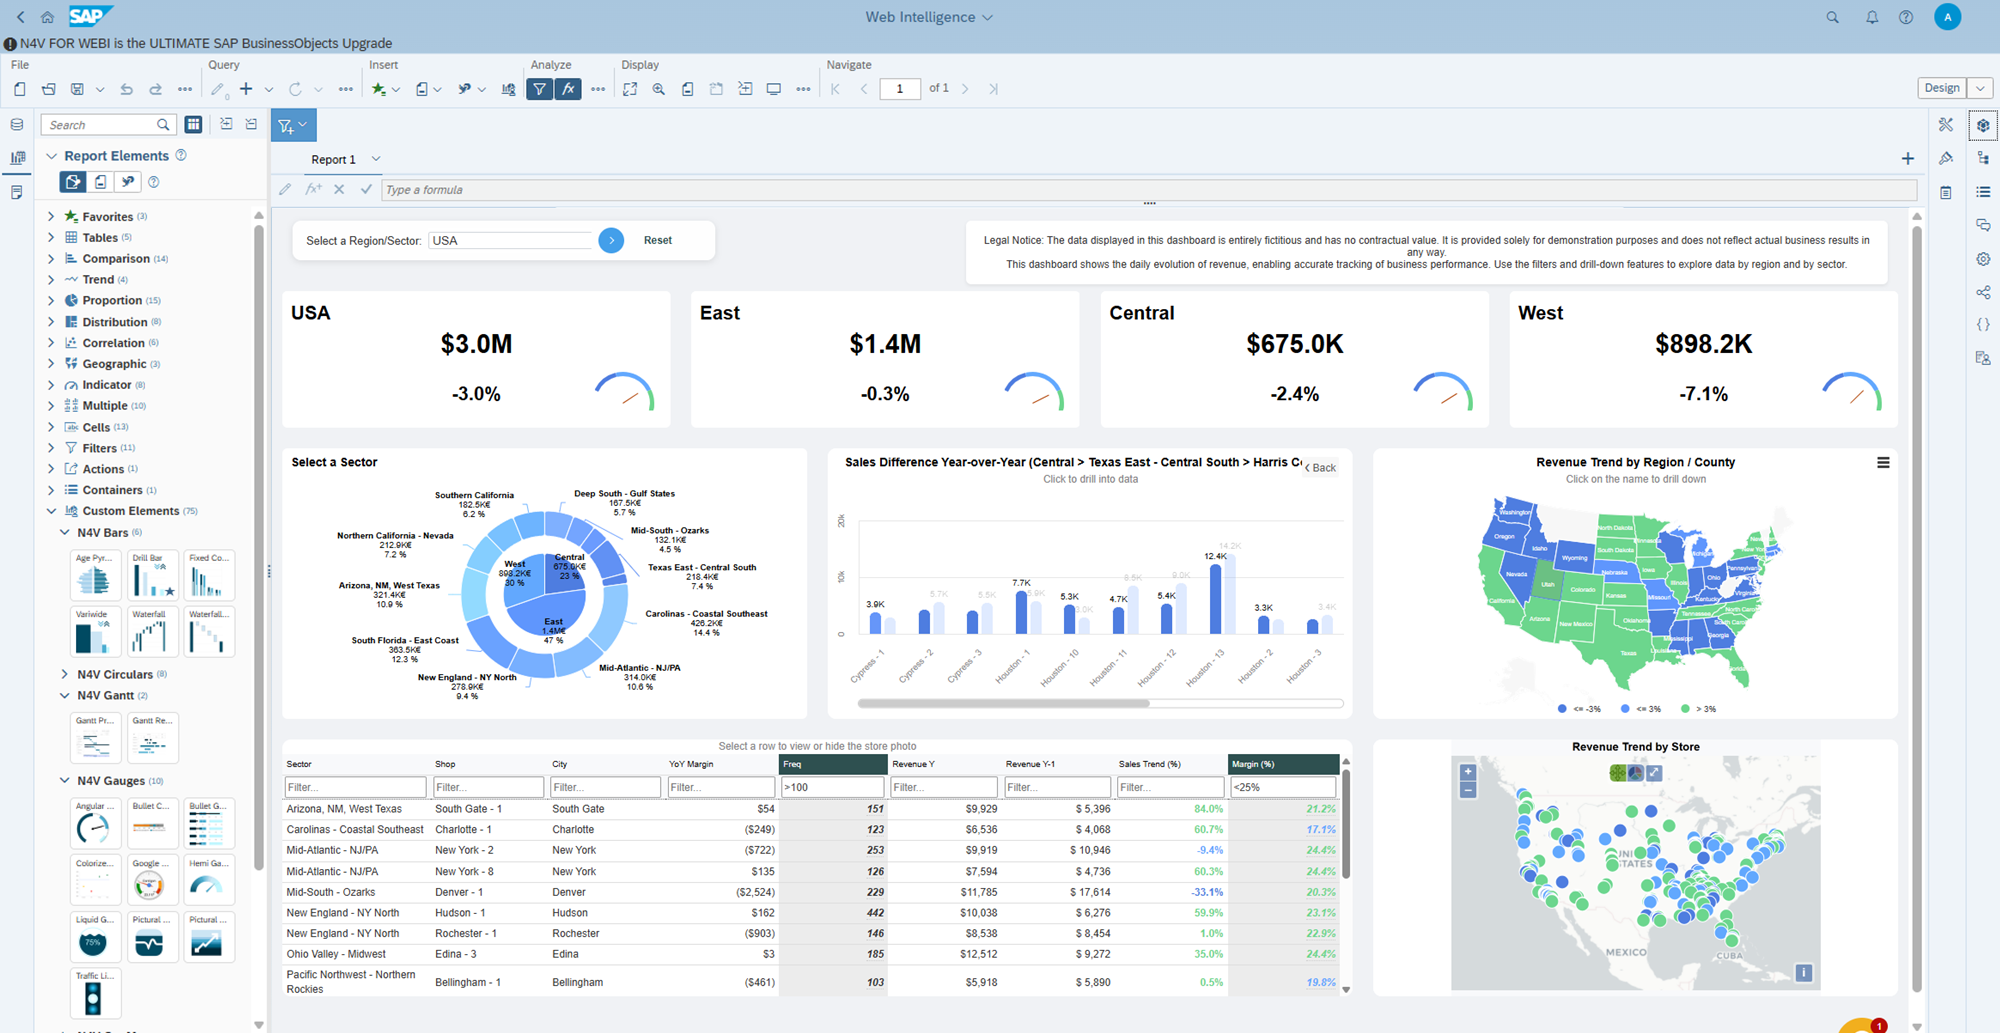
N4V Widgets
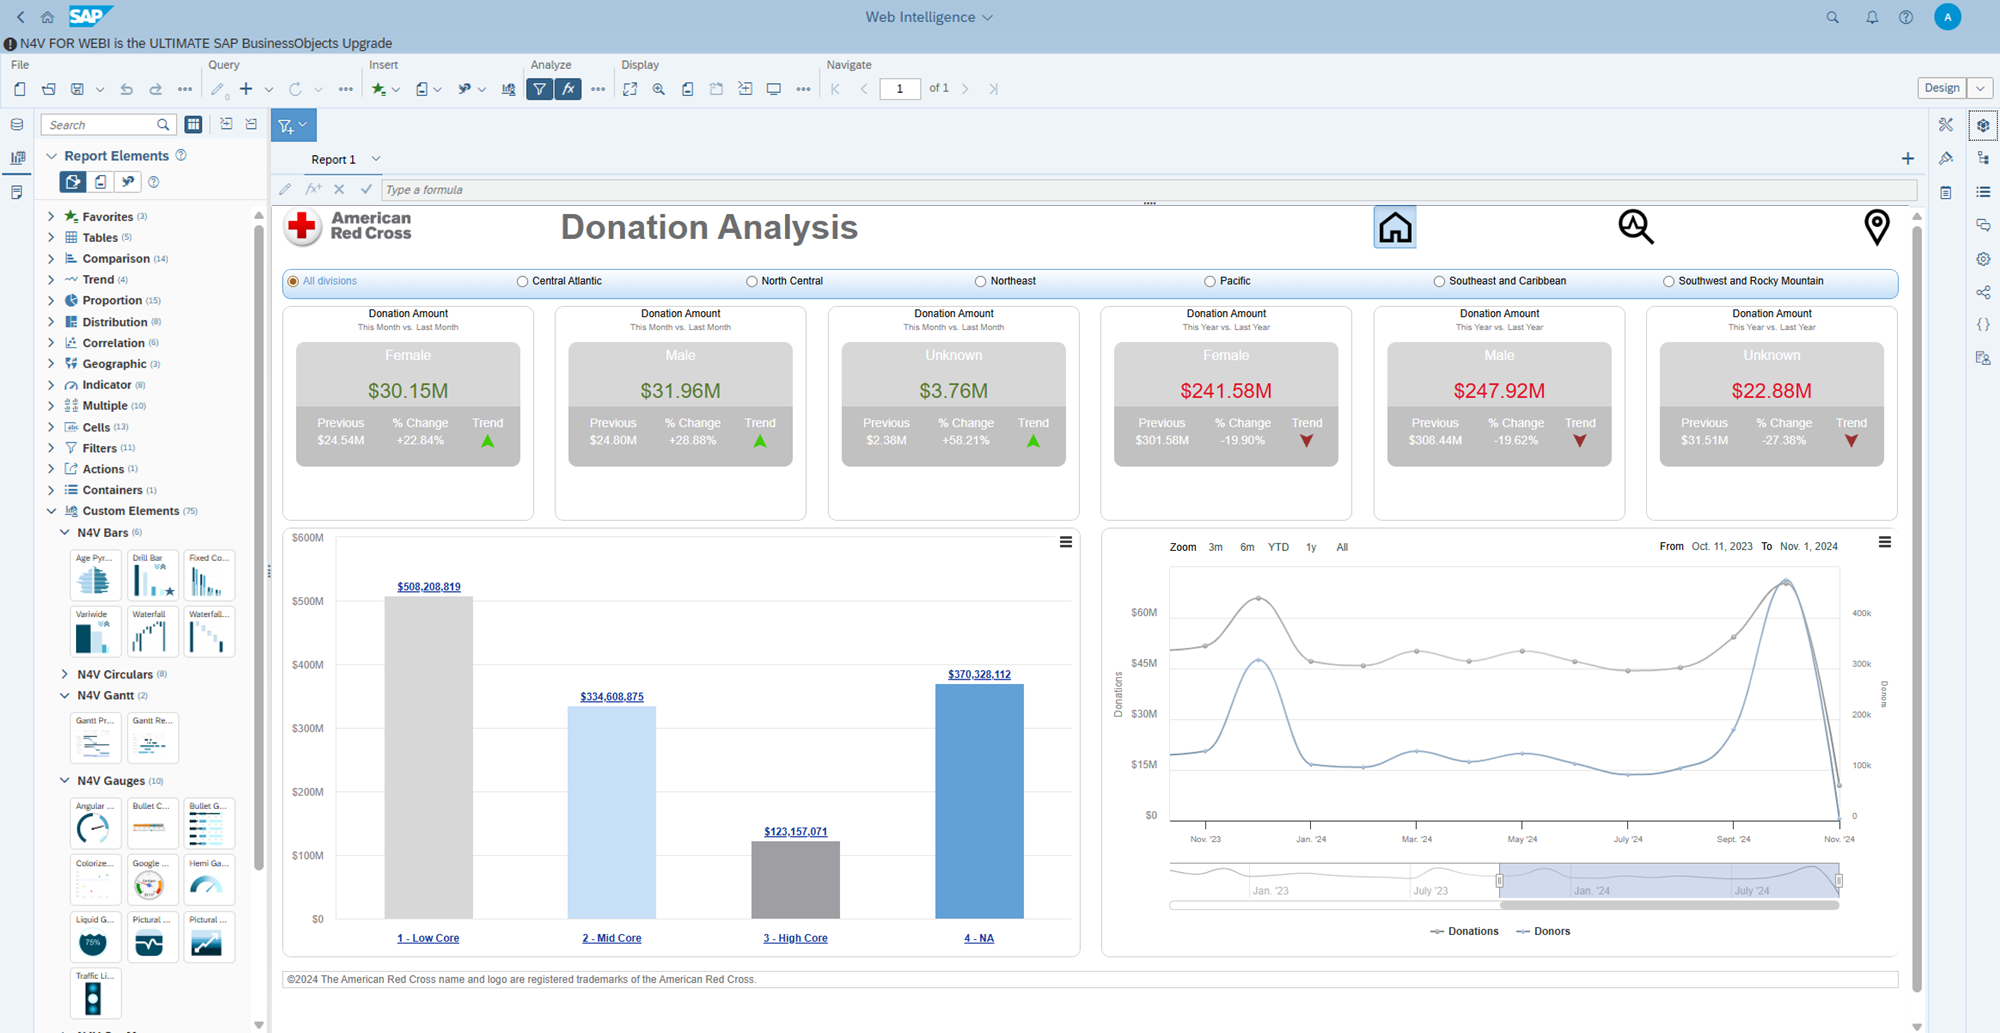
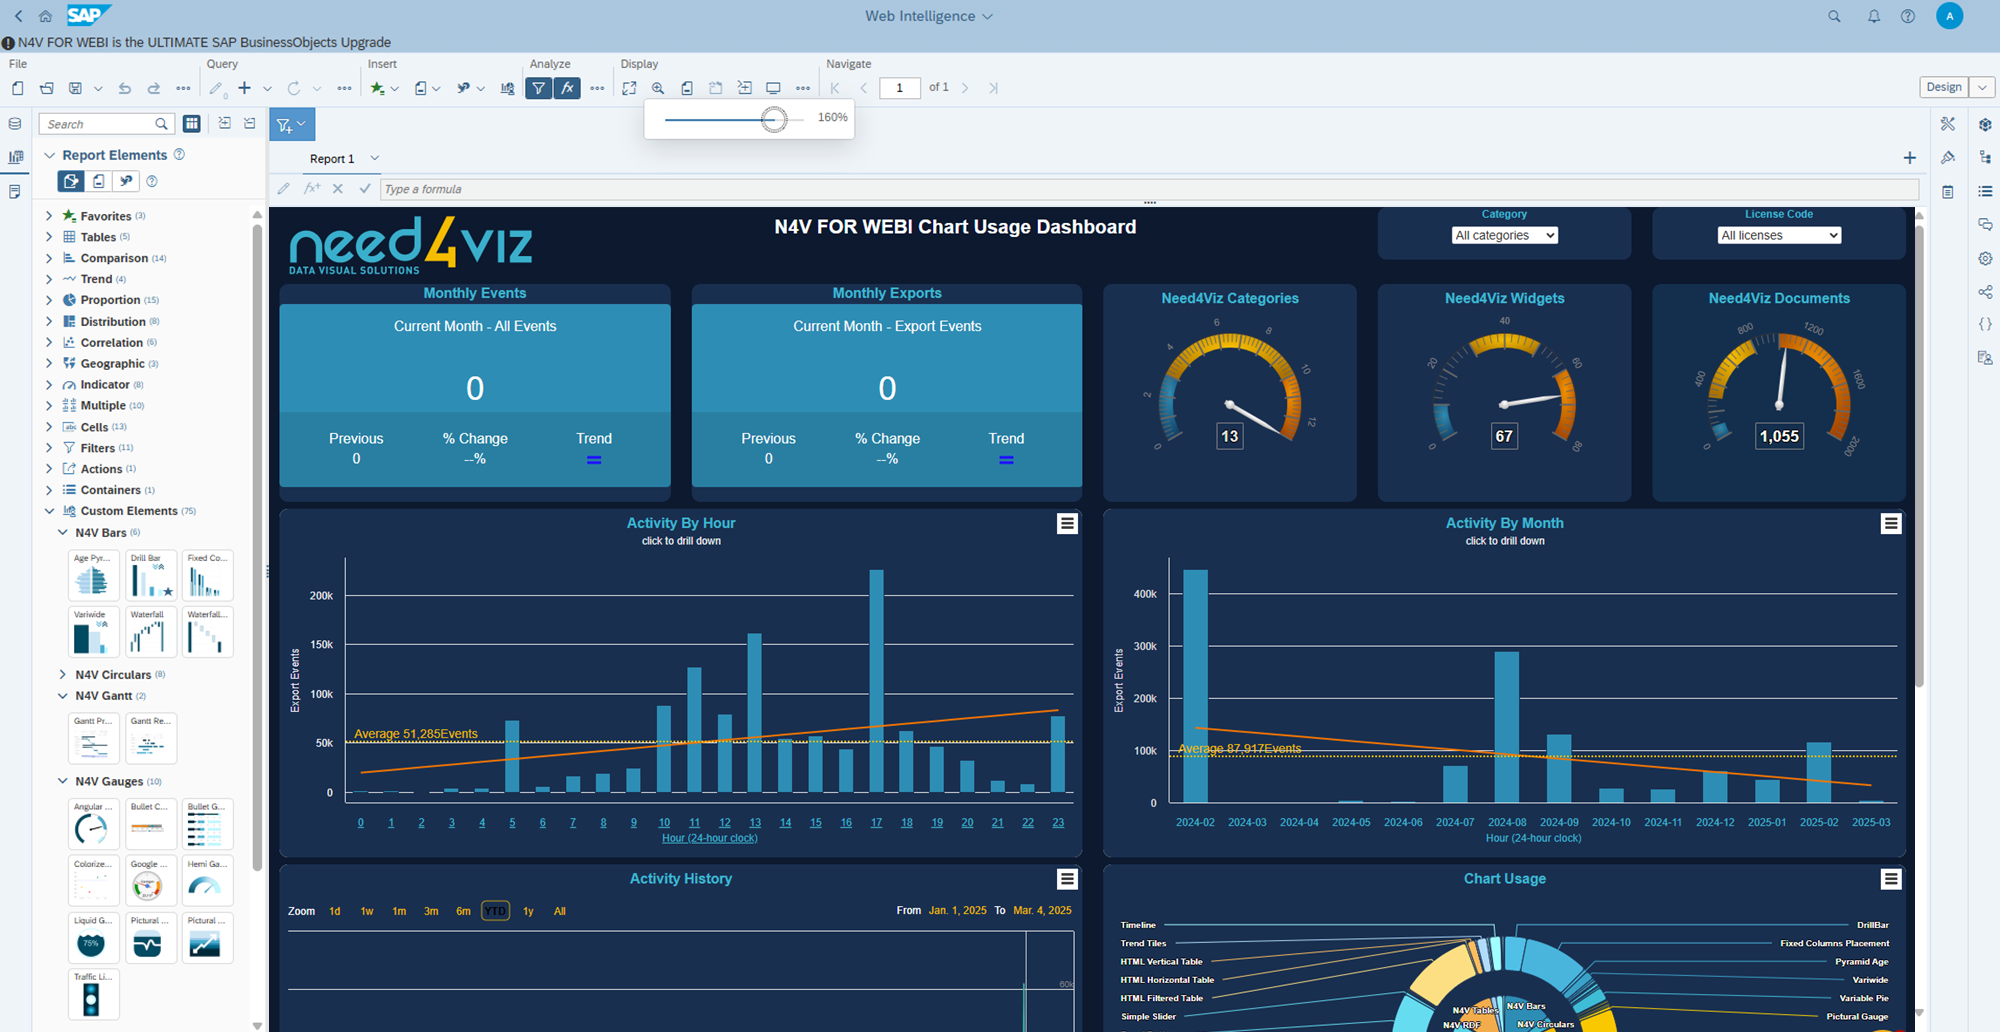
Transform Webi into a true dataviz tool with 60+ interactive, drillable and customizable widgets, plus advanced navigation filters — all without leaving SAP BO.
60+ interactive widgets without leaving SAP BO
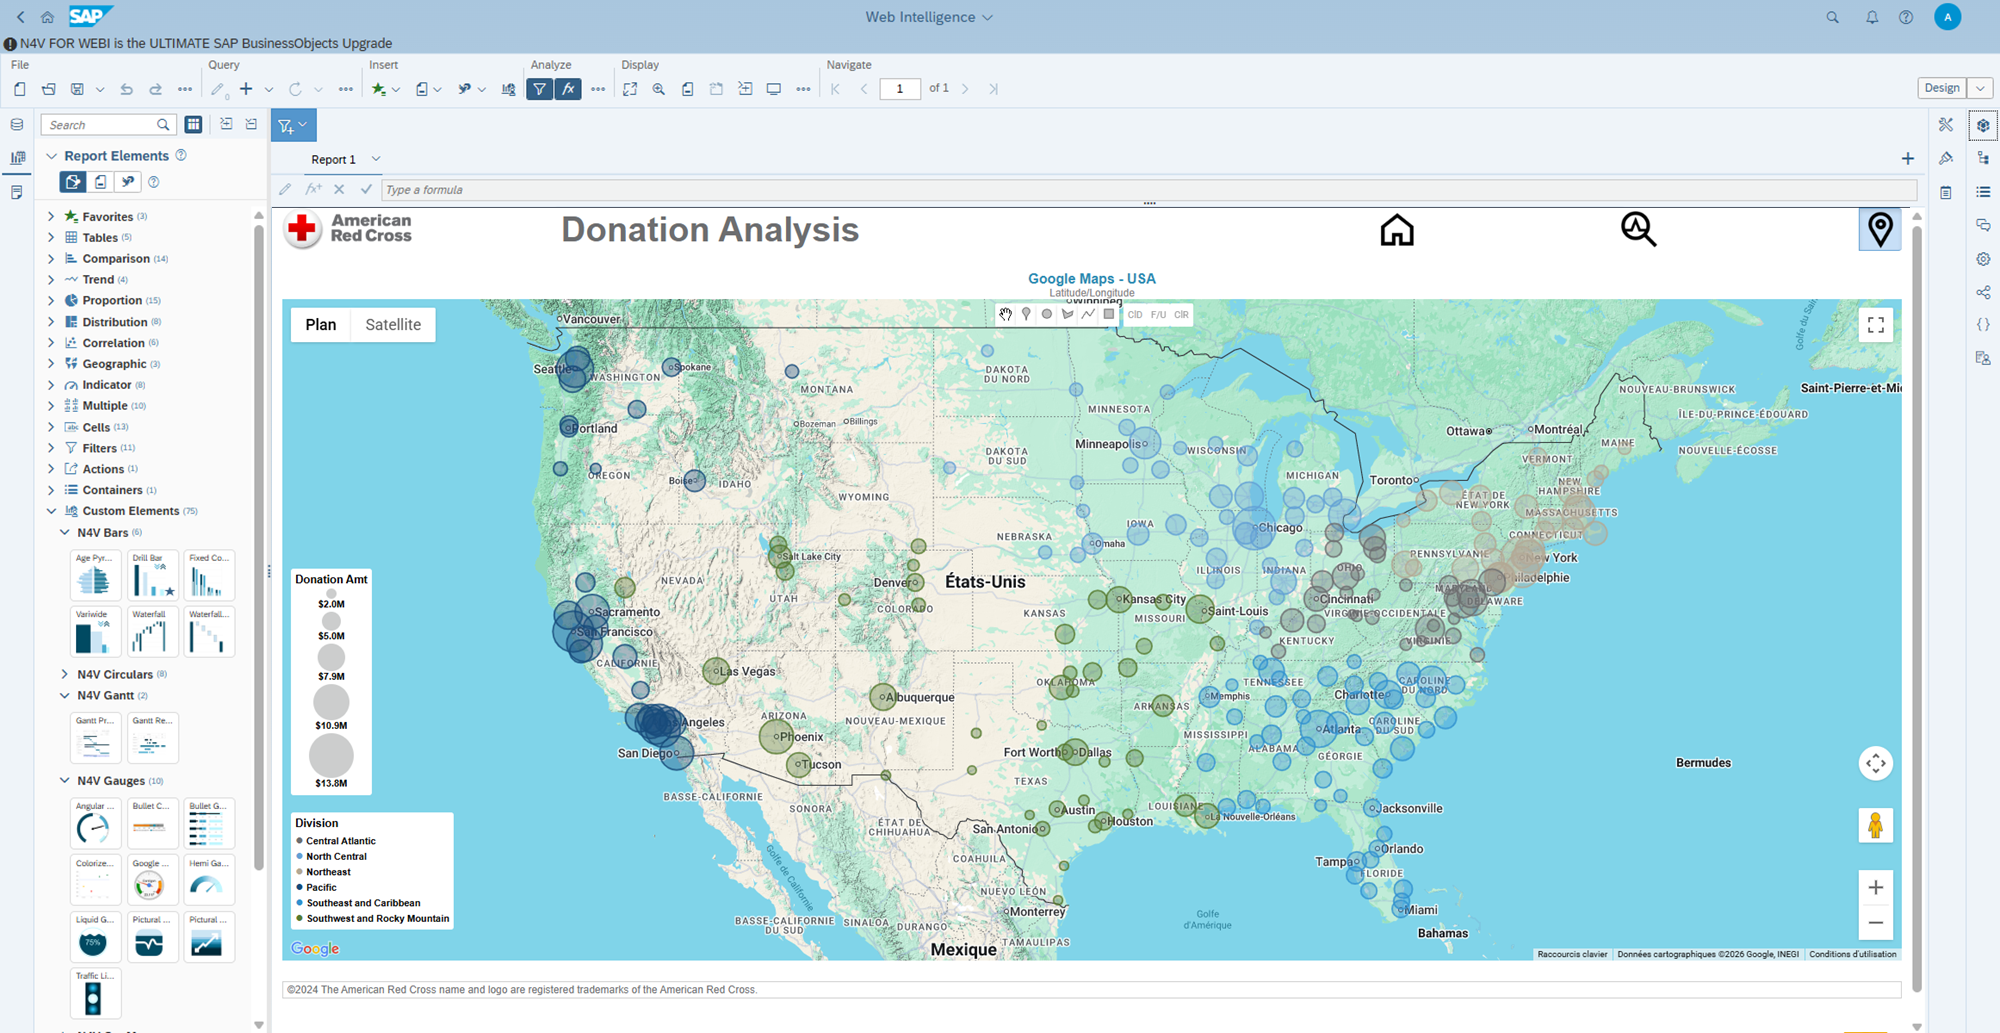
Learn more →N4V Maps
A full Geographic Information System (GIS) built into Webi — with Google Maps, OpenStreetMap, custom and drillable maps — no external tools required.
Full GIS built into Webi
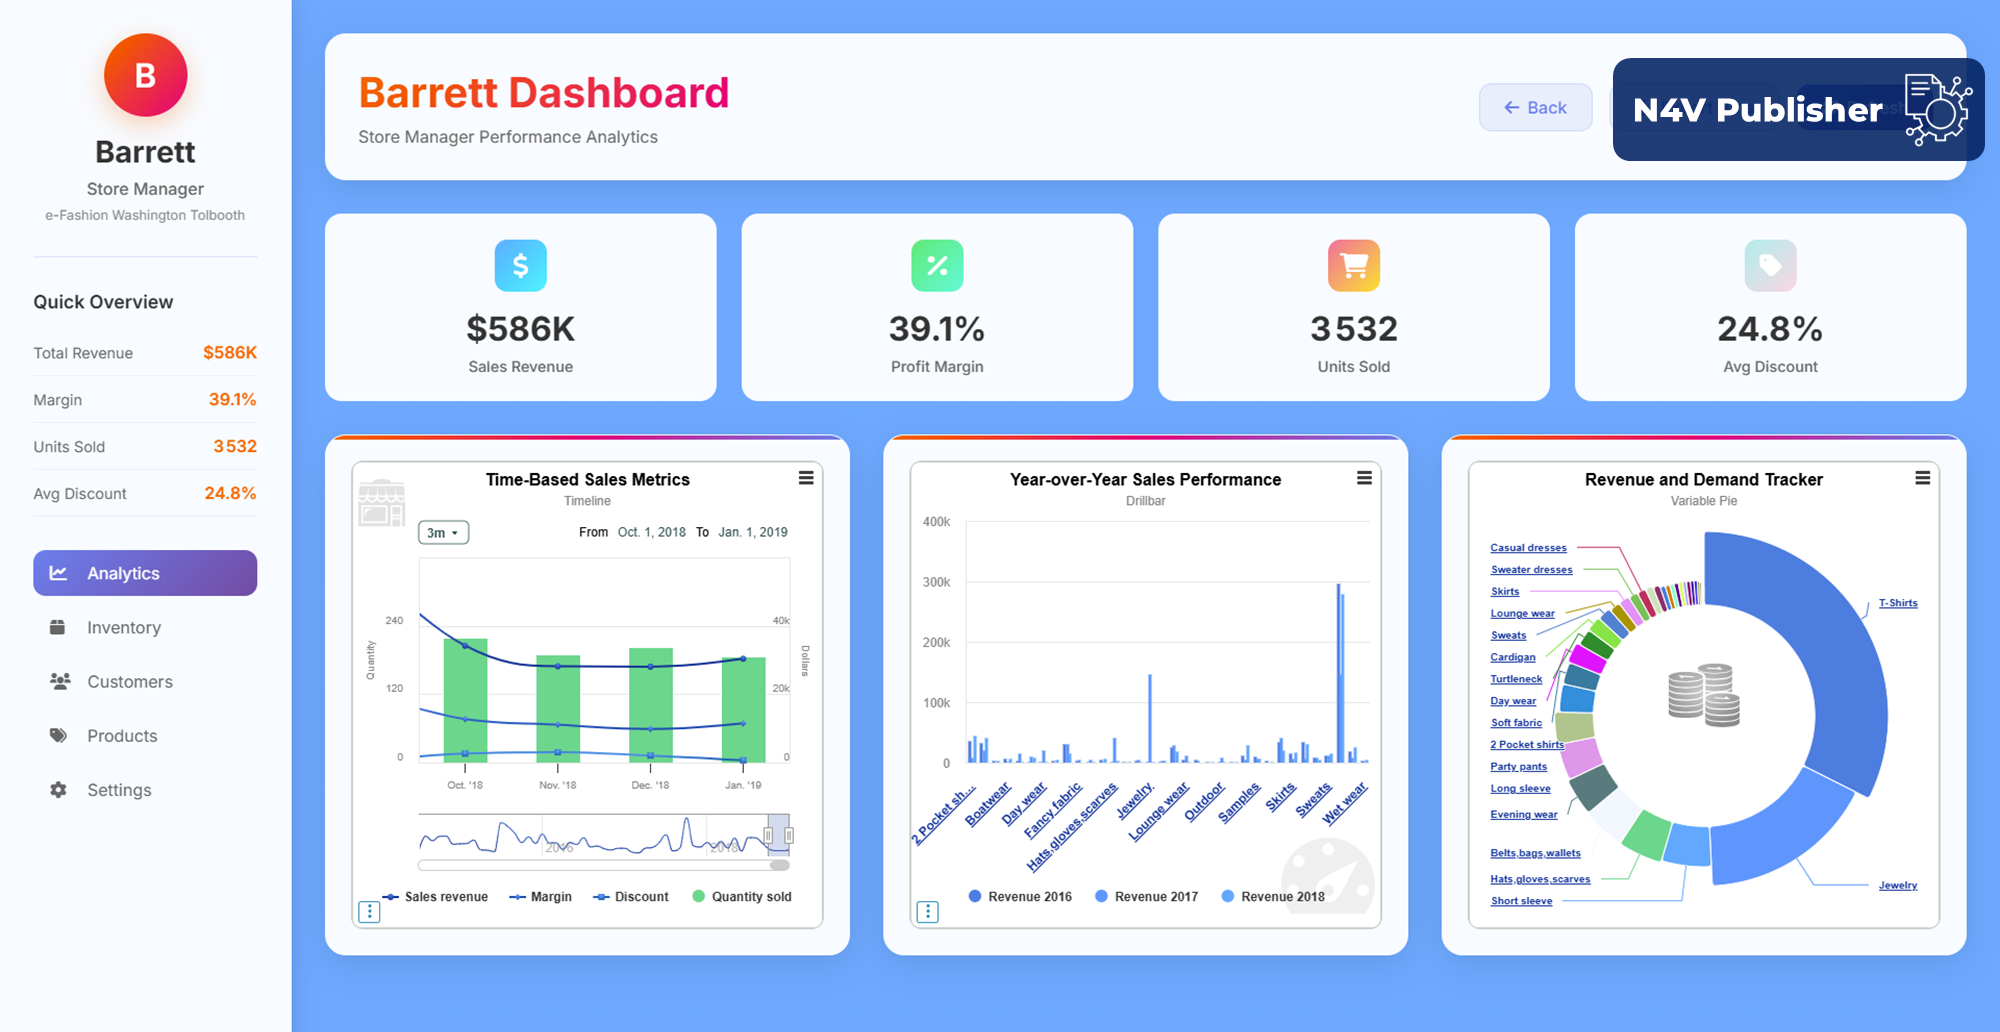
Learn more →N4V Publisher
Export Webi reports to HTML5 — making them accessible, interactive, responsive and up-to-date for all users, outside of Webi. No SAP BO license required to view reports!
HTML5 export — No SAP BO license required!
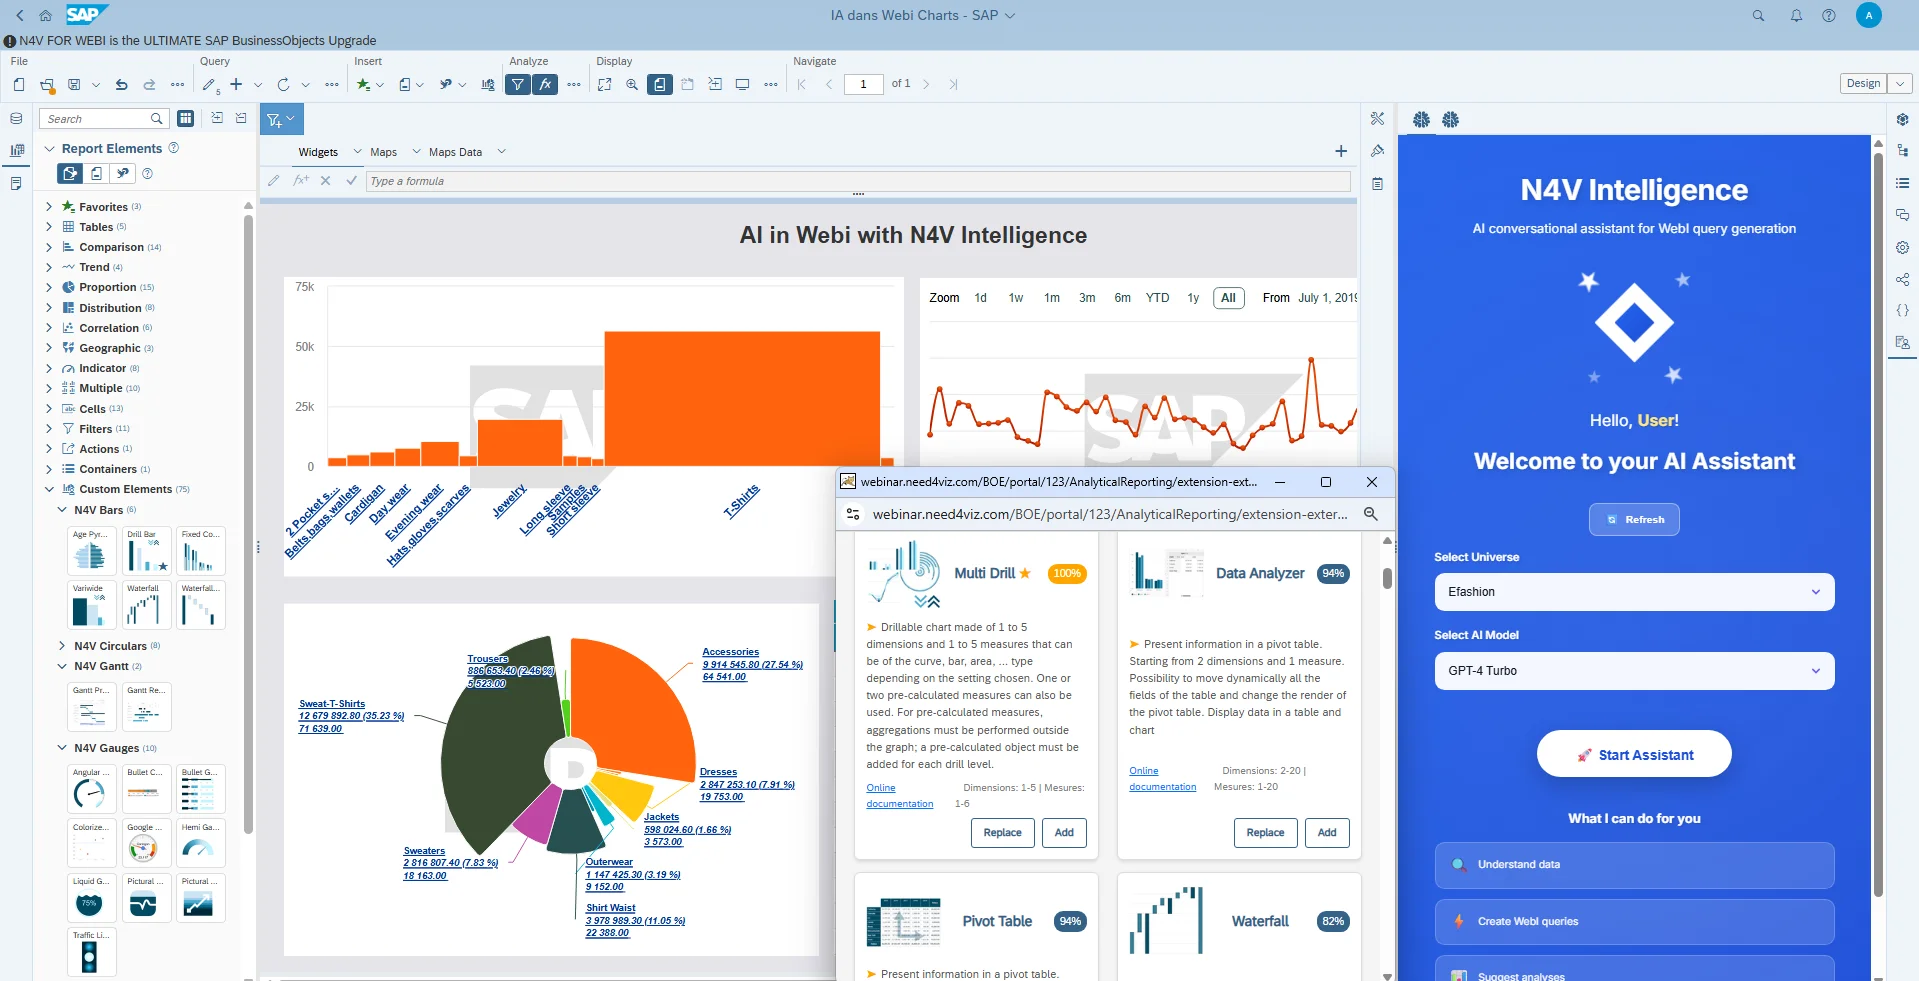
Learn more →N4V Intelligence
AI at the heart of Webi: express your needs in natural language, AI generates the query and suggests the best visual. Report creation made faster, easier and more reliable.
Natural Language Queries powered by AI
Learn more →The unique and innovative solution for SAP BusinessObjects
N4V FOR WEBI propels SAP Web Intelligence into a new dimension of dataviz and distribution. It enriches your reports with over 60 dynamic components, integrates online and offline maps, publishes your interactive dashboards on the web without additional BO license and creates documents from natural language queries thanks to Artificial Intelligence. With N4V FOR WEBI, your reports transform into true interactive dashboards, serving business needs.
Quick and easy integration
Cloud & On Premise
Choose the simplest way to use the solution, via our cloud offering, or by deploying a package on-site in your environment.
No code
You don't need to write or maintain code on your side, just configure the solution and enjoy your new charts.
Plug & Play
Just pick your favorite charts from our catalog and you can use them quickly on your site. Can't find your chart? Contact us!
Bring your data to life
Add dynamism to your presentations and easily export charts to your own website (embedded data in standalone HTML format).
Accessibility
HTML5 Export of our components enables effective implementation of European Directives on website accessibility.
Consulting & Expertise
Let our consultants deploy or configure the solution in your environment. We can also help you design the best dashboards.
No change management needed
You already know how to use N4V FOR WEBI since it's a Webi Add-on. Of course, we offer a training course if you wish.
Keep your existing setup
Keep your infrastructure, environment, universes, queries... Integrate our widgets into existing reports or start from scratch.
Help & Support
Need help? We provide efficient and responsive support (less than 24h to get a response).
4 main reasons to choose N4V FOR WEBI
FAST
Deploy N4V FOR WEBI easily by choosing the Saas platform or on-site installation. In minutes, you're ready to play with your new components.
ECONOMIC
With N4V FOR WEBI, no need to acquire a whole new product or train people on another technology. Just buy the N4V package you need.
POWERFUL
With N4V FOR WEBI, you can make your data speak through powerful charts and maps. Add powerful components to your SAPBI reporting tool.
SUSTAINABLE
N4V FOR WEBI can be installed in your existing environment and requires few resources. Get the most from your existing infrastructure with no additional carbon footprint.
They Trust Us
All business sectors worldwide use N4V FOR WEBI to increase their SAP BI data visualization capabilities


Customer Testimonials
Give more POWER to BO!
N4V FOR WEBI transforms SAP Webi into one of the most comprehensive and versatile DataViz solutions on the market.
Join the revolution!