


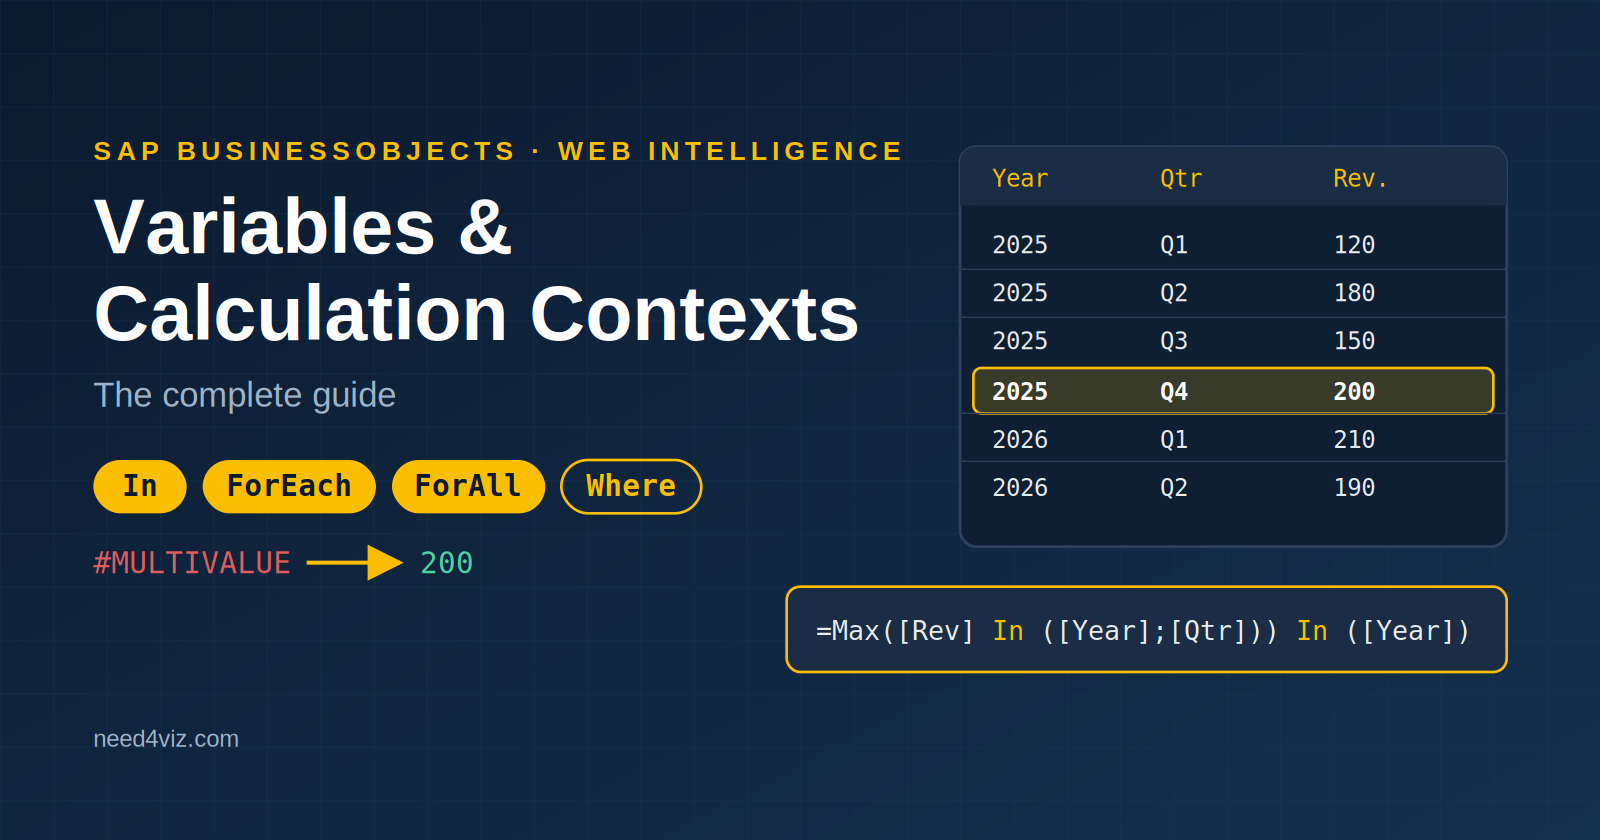
Applies to: BI 4.2, 4.3, BI 2025 · Reading time: 9 min
Definition. In Web Intelligence, a variable is a named formula that can be reused anywhere in the document. A calculation context is the set of dimensions a measure is aggregated by. By default, Webi infers that context from the dimensions present in the block (table, section, break) where the formula is displayed. The In, ForEach, ForAll and Where operators let you force a different context when the default one does not return what you expect.
This is the most searched, and most misunderstood, topic in Webi. This guide merges SAP’s documentation, the most frequent SAP Community questions and fifteen years of field experience into one place.
Why isn’t the default context enough?
Take a table with Year, Quarter and Revenue. The Revenue cell on each row is computed in the (Year; Quarter) context. If you add a column =Sum([Revenue]), Webi computes it in that same context, so you get the same figure as Revenue. What you probably wanted was the yearly total, or the report total, to compute a share or a variance. The default context is correct, but too fine-grained for those needs.
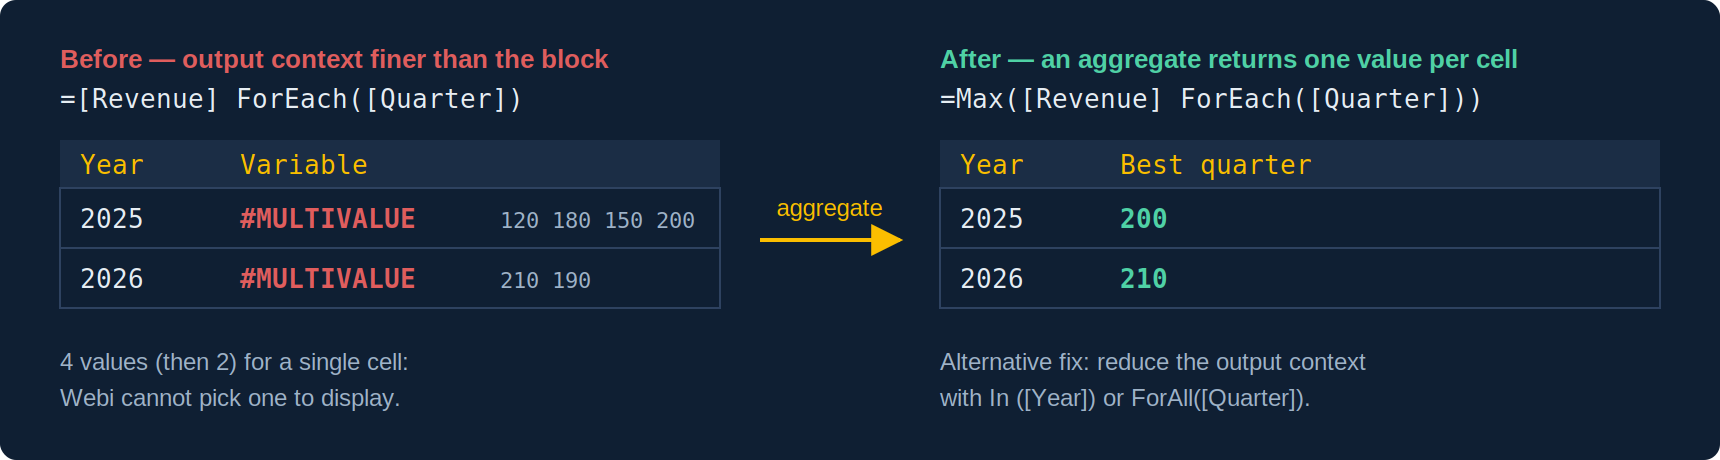
Conversely, as soon as a formula returns several values for a single cell (because its context is finer than the block), Webi displays #MULTIVALUE. Contexts exist to solve both situations.
Input context vs output context: the key to everything
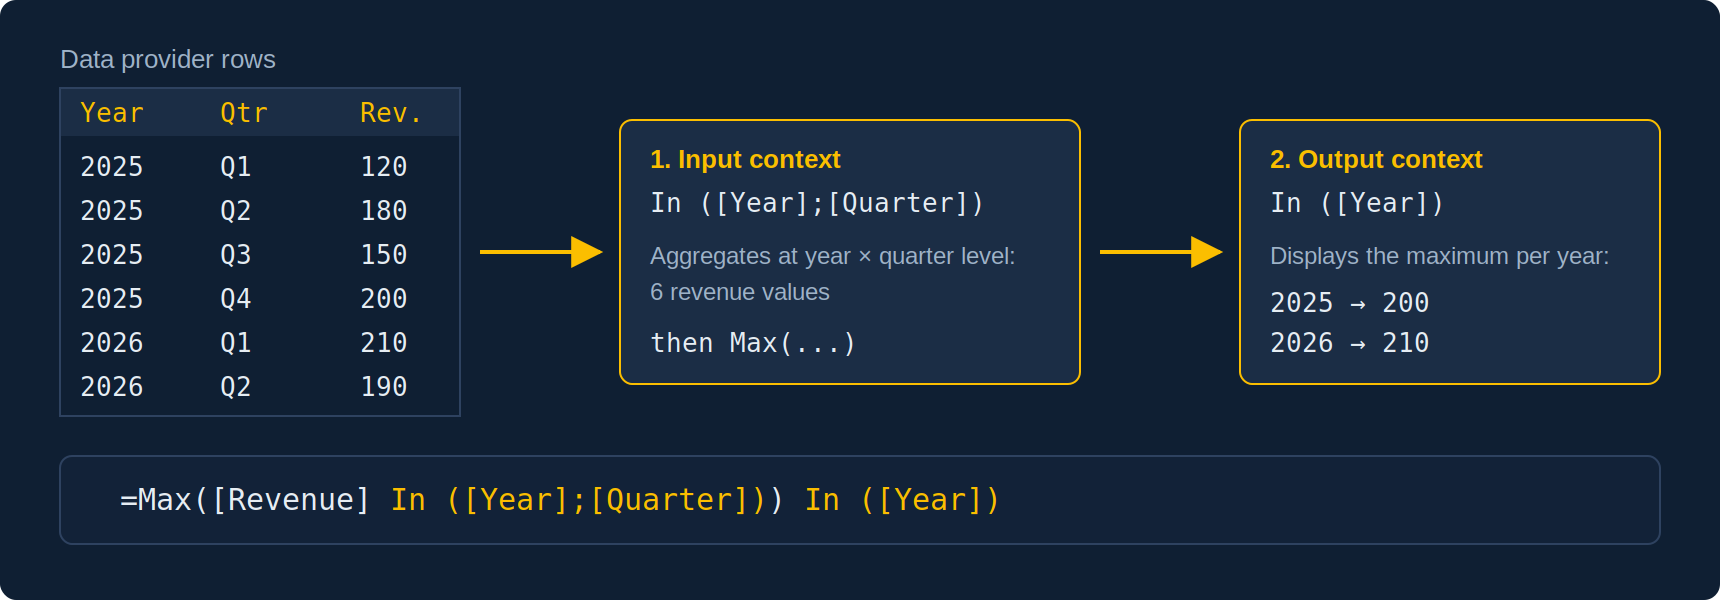
Every aggregated measure goes through two steps:
- The input context: the level at which rows are first aggregated (what is written inside the aggregate’s parentheses).
- The output context: the level at which the result is then displayed (what is written after the parentheses).
Read it as: “compute revenue by year and quarter (input), then take the maximum of those values and show it by year (output)”. Result: the best quarter of each year, in a table that only contains the year. Without the input context, Max([Revenue]) by year would simply return the yearly revenue.
In, ForEach, ForAll, Where: which one to use?
| Operator | Effect on the context | Example | When to use it |
|---|---|---|---|
In |
Replaces the context with the exact list of dimensions given | Sum([Revenue] In ([Year])) |
When you know precisely which level to aggregate at. The most readable; prefer it. |
ForEach |
Adds dimensions to the default context | Sum([Revenue] ForEach([Customer])) |
To go one level finer than the block without listing all its dimensions. |
ForAll |
Removes dimensions from the default context | Sum([Revenue] ForAll([Quarter])) |
To go one level up (yearly total in a quarterly table, for instance). |
Where |
Does not change the context; filters the rows taken into account | Sum([Revenue] Where ([Country]="France")) |
For a conditional measure without filtering the whole block. |
Rule of thumb: ForEach and ForAll are relative to the block, so the same variable can return different results depending on where it is placed. In is absolute, hence predictable: when a variable is reused across several blocks or charts, write it with In.
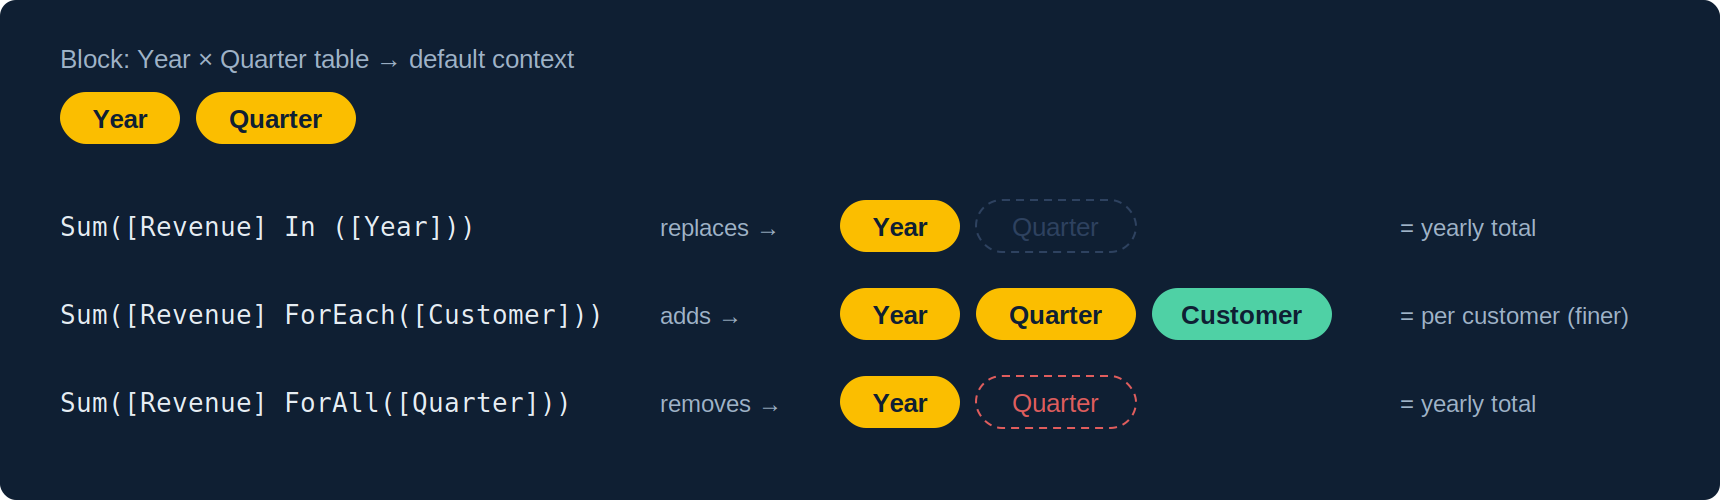
In replaces, ForEach adds, ForAll removes. Here In ([Year]) and ForAll([Quarter]) give the same result, but only In stays true if the variable moves to another block.Context keywords: Report, Section, Break, Block, Body
Instead of listing dimensions, you can name an area of the report. This is essential for share and percentage formulas.
| Keyword | Resulting context |
|---|---|
Report |
No dimension: the report total (after report filters). |
Section |
The dimension of the enclosing section. |
Break |
The dimensions of the current break. |
Block |
All dimensions of the block, breaks included: the table total. |
Body |
The cell’s default context: useful to explicitly cancel an inherited context. |
8 ready-to-use formulas
| Need | Formula |
|---|---|
| Share of report total | =[Revenue] / Sum([Revenue] In Report) |
| Share within the section (e.g. customer share of its region) | =[Revenue] / Sum([Revenue] In Section) |
| Best quarter of each year | =Max([Revenue] In ([Year];[Quarter])) In ([Year]) |
| Number of customers with revenue above 10,000 | =Sum(If([Revenue] > 10000; 1; 0) ForEach([Customer])) |
| Average revenue per customer in a table by region | =Average([Revenue] ForEach([Customer])) |
| France revenue only, without filtering the block | =Sum([Revenue] Where ([Country] = "France")) |
| Variance to yearly total in a quarterly table | =[Revenue] - Sum([Revenue] ForAll([Quarter])) |
| Customer rank across the whole report, whatever the block | =Rank(Sum([Revenue] In ([Customer])); [Customer]) |
#MULTIVALUE, #CONTEXT, #DATASYNC: how to fix them
| Error | Cause | Fix |
|---|---|---|
#MULTIVALUE |
Several values for one cell: the output context is finer than the block, or a dimension is returned without an aggregate. | Wrap in an aggregate (Sum, Max, Min), or add In ([block dimensions]) as output context. |
#CONTEXT |
The requested context is incompatible with the data: a dimension from another, unmerged query, or an object missing from this data provider. | Merge the dimensions, or rewrite with objects from the same provider. |
#DATASYNC |
A block mixes unmerged dimensions from several queries. | Merge the common dimension, or create a detail variable attached to the merged dimension. |
#INCOMPATIBLE |
Objects incompatible at universe level (different SQL contexts). | Split into two queries and merge, or fix the universe. |
What if you described the formula instead of writing it?
The difficulty with contexts is not conceptual, it is syntactic: you know what you want (“the best quarter of each year”), you don’t always know how to write it, and Webi offers neither an assistant nor an explicit error message. That is exactly what N4V Intelligence addresses: you describe the calculation in plain language, right inside Webi, and the assistant generates the variable with the correct input and output contexts, ready to be checked and inserted into the document. It can also explain an existing formula, or a #MULTIVALUE error, in one sentence.
N4V Intelligence:
=Sum([Revenue] In ([Region];[Customer])) / Sum([Revenue] In ([Region])) — input context region + customer, output context region, independent of the block the variable is placed in.
5 best practices for maintainable variables
- Name variables after their intent (
Revenue share of region,Best quarter), not their formula. - Prefer
Inwith the full dimension list whenever a variable is reused in several blocks or charts. - Write input and output contexts explicitly, even when one of them is the default: the formula becomes self-documenting.
- Test a new variable in a flat table containing all dimensions before placing it in an aggregated block.
- Avoid stacking more than two levels of nested variables: beyond that, debugging becomes impossible and performance drops.
Frequently asked questions
What is the difference between In, ForEach and ForAll?
In sets the exact list of dimensions. ForEach adds dimensions to the default context. ForAll removes them. All three are equivalent if you write the full list with In; the latter is simply more readable and independent of the block.
Why does my variable show #MULTIVALUE?
The formula’s output context has more dimensions than the block: Webi finds several values for one cell. Aggregate the formula or reduce its output context.
Do contexts work in charts?
Yes, a chart is a block like any other: its default context is made of the dimensions placed on axes and legend. The same rules apply.
Did contexts change between BI 4.2, 4.3 and BI 2025?
No. Syntax and calculation engine are identical; this guide applies to every supported version.
Do I still need calculation contexts if I use an extension like N4V?
Yes. Widgets, maps and dashboards built on top of Webi consume the document’s variables. A correctly contextualised variable displays correctly everywhere, including in enhanced charts.
Sources and references
- SAP Help Portal — SAP BusinessObjects Web Intelligence User’s Guide (BI 4.3 / 2025)
- SAP Community — SAP BusinessObjects BI Platform hub
- Need4Viz field experience on BI 4.1 to BI 2025 deployments
👉 Discover Need4Viz and what we really bring to SAP Web Intelligence
Need4Viz extends SAP Web Intelligence with advanced dataviz, interactivity, automation and AI capabilities to transform your reports into real decision-making tools.
Discover Need4Viz