


Applies to: BI 4.3, BI 2025 · Reading time: 9 min
In short. The total cost of ownership (TCO) of a BusinessObjects platform is not the SAP maintenance invoice. It adds up licenses, infrastructure, operations, universe and report development, training and support, plus hidden costs that few IT departments measure: unused licenses, parallel tools bought “for the visuals”, manual Excel exports. This article breaks down these items, gives the levers to reduce them, and puts the cost of migrating to another tool into perspective, almost always underestimated because a license is compared to a license instead of a TCO to a TCO.
The TCO items

| Item | What it contains | Typical share |
|---|---|---|
| Licenses and maintenance | Amortised perpetual licenses + annual SAP maintenance, or subscription (Private Cloud Edition) | 25 to 35% |
| Infrastructure | Servers (CMS, Webi, Job), repository database, FRS storage, DEV/TEST/PROD environments, backups | 10 to 15% |
| Operations | Platform administration, patches and upgrades, monitoring, rights management | 15 to 20% |
| Development | Design and maintenance of universes, reports, schedules; business changes | 25 to 35% |
| Training and support | Designer and reader training, level 1 and 2 support | 5 to 10% |
| Hidden costs | Unused licenses, a second visualisation tool, Excel exports and rework, duplicate reports | Variable, often 10 to 20% |
Shares are orders of magnitude observed on mid-sized estates; they vary with user count and degree of outsourcing.
Licenses: understanding what you pay for
- Named user: one license per person, whatever their usage. Simple, but expensive when half the named users log in once a quarter.
- Concurrent session: one license per simultaneous session. Suited to large populations of occasional readers; size it on peak usage (closing periods).
- Annual maintenance: a percentage of the license price, every year, giving access to releases and support. It is the item you “see”, and the one wrongly compared to a competitor’s subscription price alone.
- Subscription: Private Cloud Edition turns licenses and maintenance into a subscription including hosting and operations; SAP Analytics Cloud is a per-user subscription. Comparing a subscription to a maintenance fee only makes sense if you add to the maintenance the infrastructure and operations it does not cover.
- The Auditor report is the tool to reconcile licenses and actual usage: in the estates we see, 20 to 40% of named licenses go unused.
Hidden costs, item by item
- The second tool: a visualisation subscription bought “for dashboards” alongside BO. It duplicates the semantic layer, security, training, and adds a data flow to maintain. It is the most frequent and the most expensive hidden cost.
- Excel exports: every report business users export to rework is a report whose development cost produced no value, and a risk of diverging figures.
- Duplicate reports: ten versions of the same statement, with different filters, maintained by different people. The estate audit reveals them.
- Oversized environments: servers sized for peaks that no longer exist, or for slow reports that an optimisation would have fixed (see our performance article).
- Version lag: staying on an out-of-maintenance version costs in security risk, progressive incompatibilities (OS, Java, browsers), and a heavier upgrade project the day it becomes unavoidable.
Levers to reduce TCO
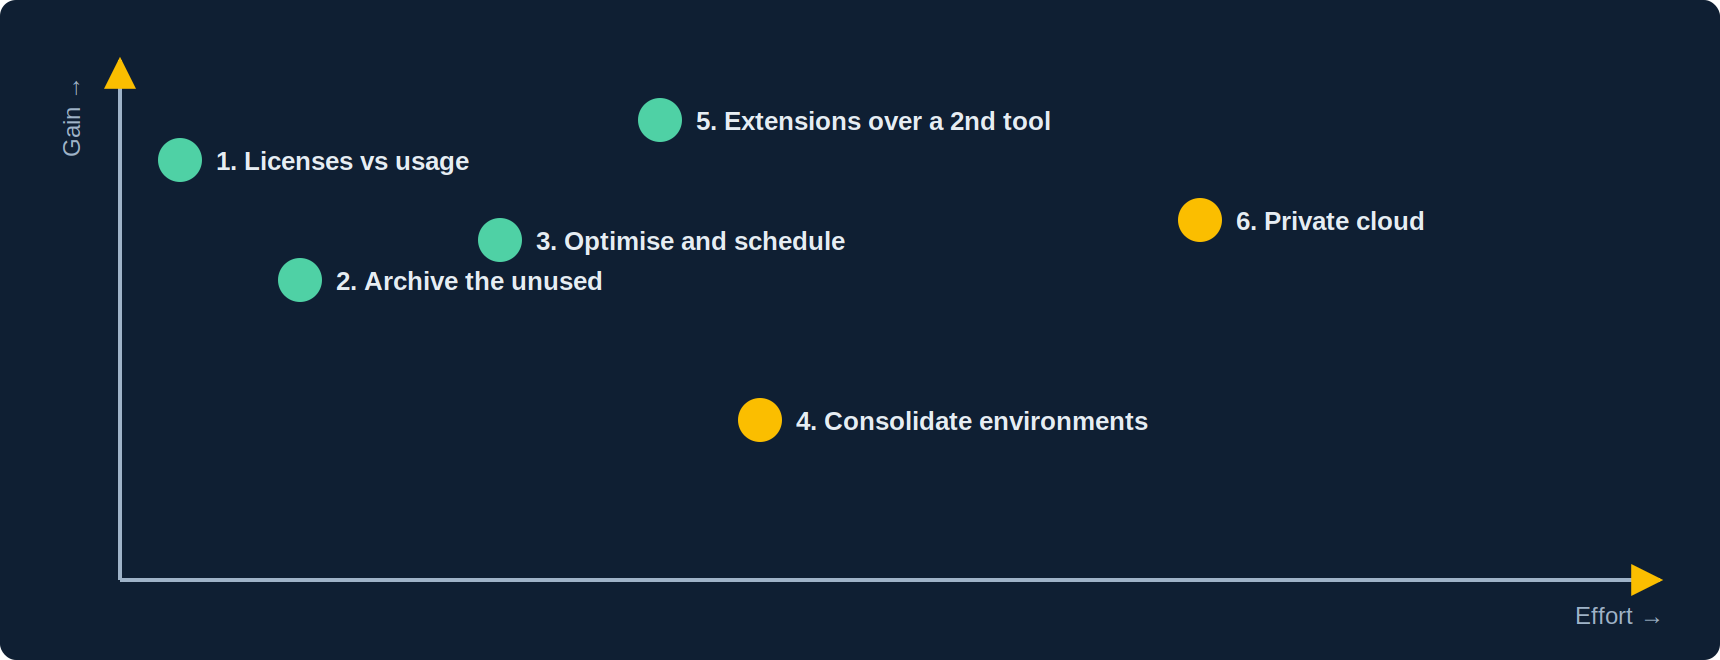
- Reconcile licenses and usage: Auditor, then renegotiation or partial switch to concurrent sessions. Immediate gain on maintenance.
- Archive the unused estate: fewer reports to maintain, migrate, secure; less storage.
- Optimise and schedule: heavy reports scheduled overnight, instances served by day; servers are sized on a lower real load.
- Consolidate environments: shared DEV and TEST, virtualised servers; BO infrastructure tolerates consolidation well.
- Modernise through extensions rather than buying a second tool: the visual need is real, but it costs a fraction of the price when handled inside Webi, on existing universes, with no new platform.
- Move to private cloud if operations weigh: Private Cloud Edition replaces infrastructure and administration with a subscription; cost it against the real internal cost, not against maintenance alone.
The cost people forget: leaving
The reasoning “BO maintenance costs X, tool Y’s subscription costs less” omits three things. First, subscription Y comes on top of a full TCO (infrastructure or cloud, operations, development, training) that must be rebuilt. Then, the migration itself: rebuilding the semantic layer, redeveloping critical reports, a one-to-three-year parallel run during which you pay for both. Finally, what you lose: burst publications, row-level security in universes, paginated statements, which tool Y does not do or does less well. On a mid-sized estate, migration cost typically represents five to ten years of BO maintenance (see Migrate or modernise).
Frequently asked questions
How do I get the number of actually active users?
Through Auditor (login and document-open events over twelve months) or by querying the audit tables. It is the first step of any renegotiation.
Are perpetual licenses still worthwhile?
Yes for a stable estate and an IT department already operating servers: maintenance alone is often lower than an equivalent subscription. Subscription wins when operations are outsourced or the population fluctuates.
Does an upgrade to BI 2025 change the license cost?
No, a version upgrade is covered by maintenance. What changes is the project cost, and the cost of not doing it.
Should business users’ time be included in the TCO?
Time spent reworking exports, yes: it is a cost of reporting non-quality. It is often what justifies modernisation.
Sources and references
- SAP Community — “SAP Analytics Business Intelligence Statement of Direction, July 2025 update” (Private Cloud Edition: from maintenance to subscription)
- SAP Community — “Journey to Cloud”: Private Cloud Edition and hybrid
- SAP — SAP BusinessObjects license models (named user, concurrent session): customer contract terms, not public
- SAP Help Portal — BI Platform Administrator Guide (Auditor, sizing)
- Wiiisdom — “SAP BI end of life stages” (cost of version lag)
- Need4Viz field experience on BO estate and license audits; shares and ratios quoted are observed orders of magnitude, not SAP figures
👉 Discover Need4Viz and what we really bring to SAP Web Intelligence
Need4Viz extends SAP Web Intelligence with advanced dataviz, interactivity, automation and AI capabilities to transform your reports into real decision-making tools.
Discover Need4Viz