


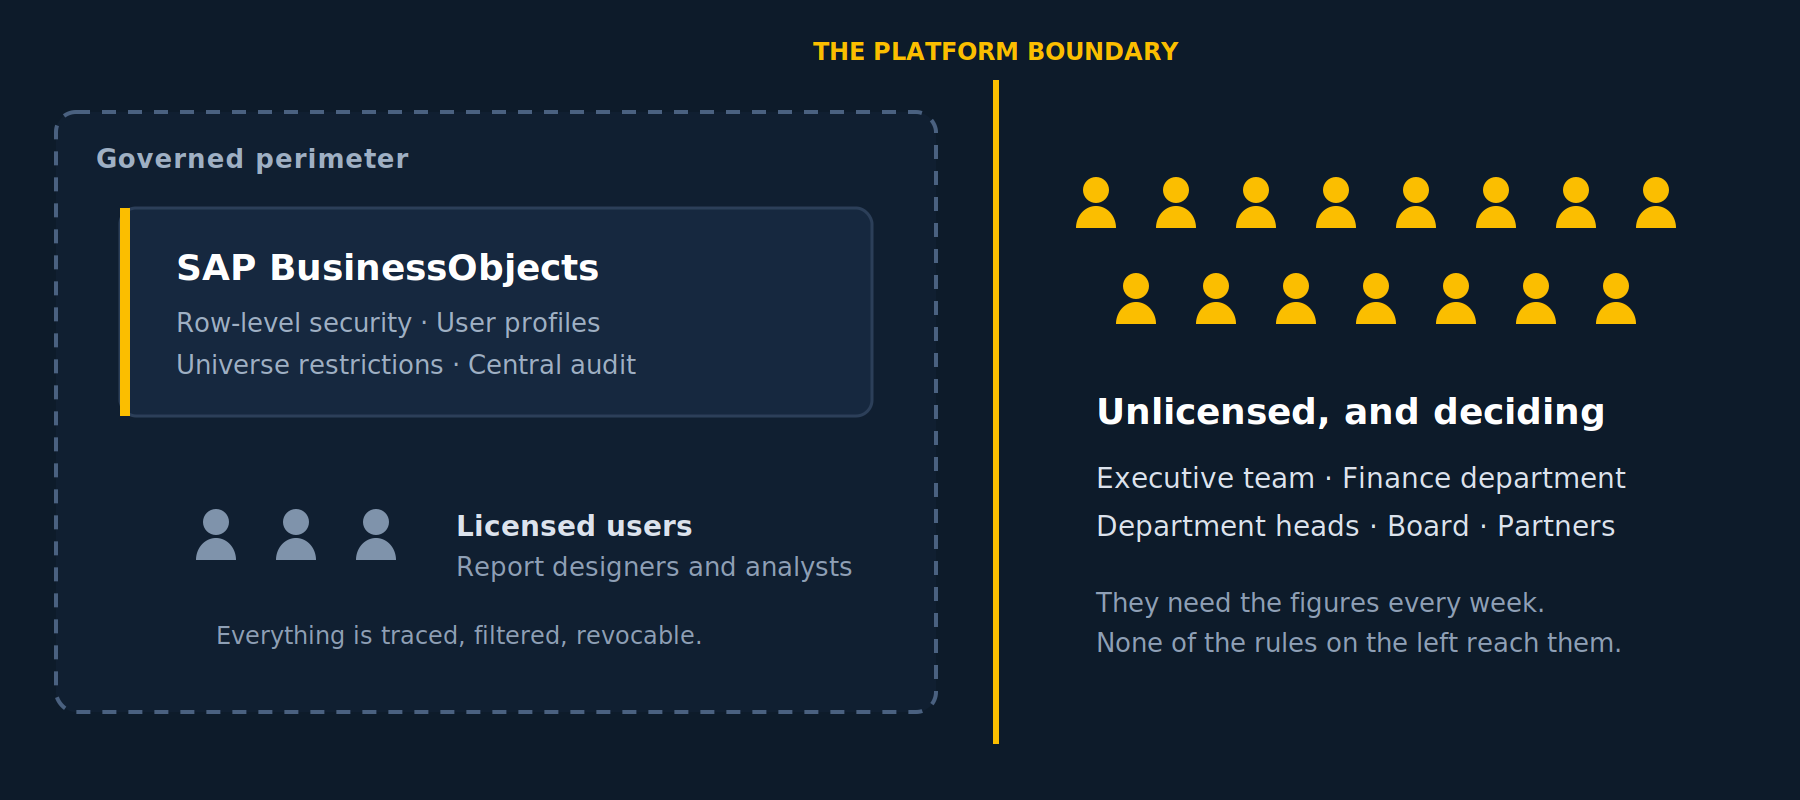
The report is ready. It is accurate, it is current, it lives in BO. The person who needs to read it has no licence. That is the exact moment when it is decided how your data will travel.
In most organisations, a handful of people work inside the BI platform and a great many others consume what comes out of it. The executive team, the finance director, department heads, board members, sometimes an external partner. They have no licence, they never will, and they need the figures.
Whatever happens next does not come out of an architecture committee. It is decided under time pressure, by whoever was asked to produce the numbers.
The Monday morning PDF
By far the most common answer. It costs nothing and it works straight away.
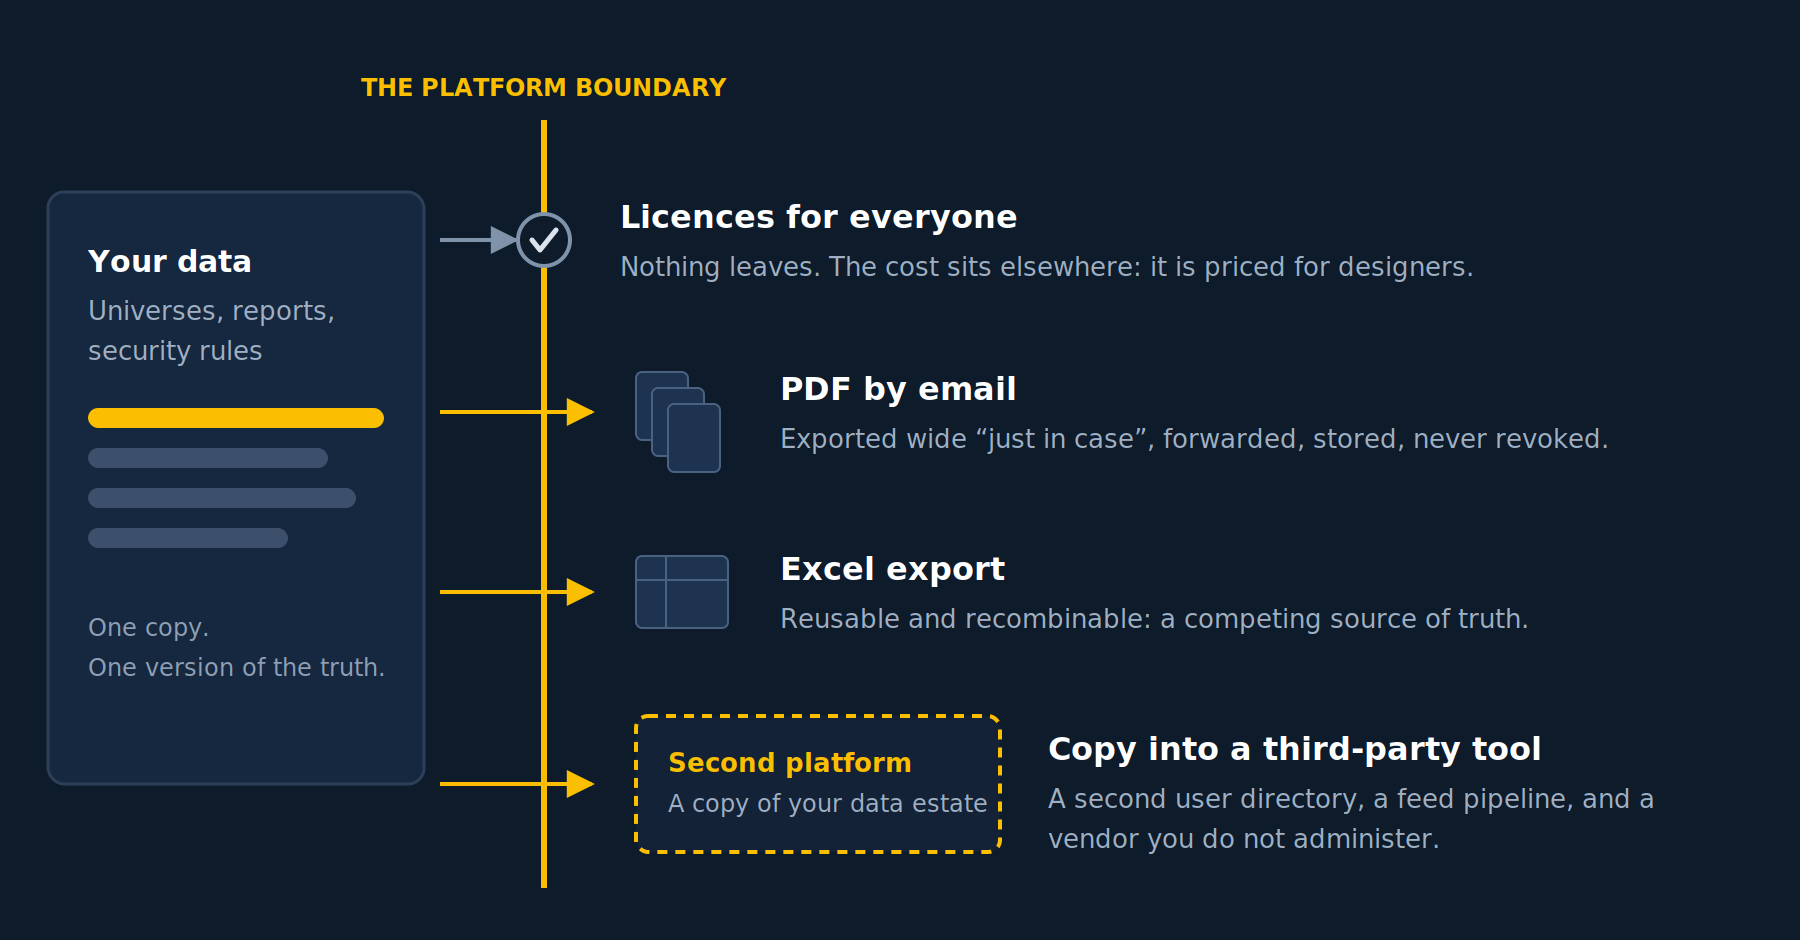
The file is frozen at export time, so it is already out of date when it arrives. That much is well known. The habit it creates is less so: since nobody wants to produce twelve tailored versions of the same document, the export goes wide. Every entity, every row, every detail, in case a question comes up. Someone who needed three indicators ends up with the entire scope in their inbox.
The file then travels freely: forwarded to a colleague, saved on a laptop, printed, dropped into a shared folder. Six months later there is no way to say how many copies exist or where they are.
The Excel export
The same limitations as the PDF, with a file that can now be reworked, recombined and merged with others.
The main cost is paid in meetings. The official report gives one figure, the reworked spreadsheet gives another, and the session is spent reconciling them rather than deciding anything.
Buying licences
On governance grounds the approach is faultless: every reader is identified, their rights are the ones granted to them, their activity is traced, and the data never leaves the platform.
The difficulty lies elsewhere. A licence costs the same for the person building universes and for the person looking at a dashboard three minutes a month. Add account creation, permissions management and support for occasional users. In practice this option rarely extends beyond a small circle, which is what leads to the next one.
Copying the data somewhere else
A third-party visualisation tool is fed with an extract, the dashboards are rebuilt there, and read access is opened to everyone. The interface is modern, users are satisfied, the matter appears settled.
What comes with it:
- a second copy of the data to secure, back up and keep consistent with the first;
- a second user directory, with its own permissions, usually coarser than the original;
- an additional feed pipeline, which becomes one more point of failure;
- an additional vendor, with its terms, its pricing and sometimes a hosting location outside your control.
Above all, row-level security, profiles and traceability — everything configured on the BO side — do not survive the export. What lands in the other tool is a bare dataset whose access rules have to be written from scratch.
The fifth option
All four approaches rest on the same assumption: that showing a dashboard to an unlicensed user requires the data to leave the platform, either in a file or in another tool.
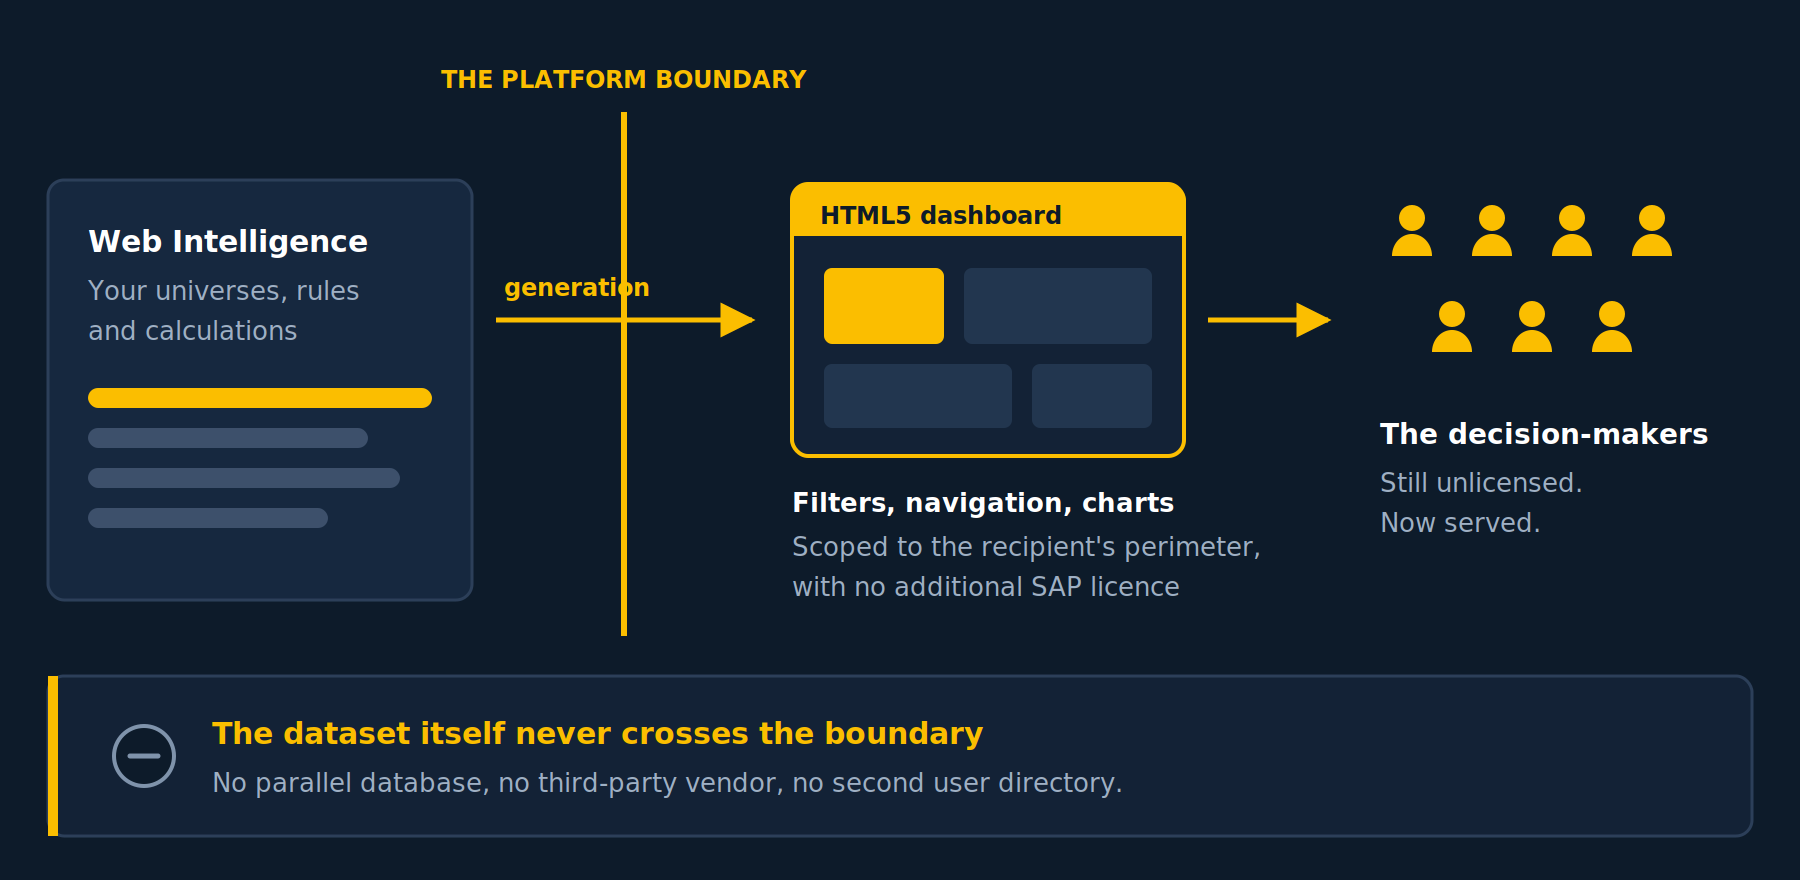
That assumption can be set aside. N4V Publisher generates, from a WebI report and on your own infrastructure, an HTML5 dashboard published to a web server: filters, navigation and charts stay in the reader’s hands. No additional SAP licence, and no copy in a third-party platform.
The report is still maintained in WebI, with your universes and your calculations. What is made available is generated from it. Nothing new enters the application estate.
The five options side by side
| Approach | Extra licence | Interactivity | Freshness | What goes out | Leaves the perimeter | Effort |
|---|---|---|---|---|---|---|
| PDF by email | None | None | Frozen at send time | The full detail, as a precaution | Yes, with no trace and no way back | Immediate |
| Excel export | None | Through local rework | Frozen at send time | The full detail, reusable | Yes, with competing figures | Immediate |
| Licences for everyone | Yes, per user | Full | Real time | Nothing: the data stays put | No | Accounts, rights, training |
| Copy into a third-party tool | Yes, on the other platform | Full | Depends on the feed | The whole dataset | Yes, permanently | A project in its own right |
| N4V Publisher | No additional SAP licence | Full (filters, navigation, charts) | The page follows the report refresh | Nothing is sent: a published page | No third party, no parallel database | From an existing report |
Publishing rather than sending
What separates this from the four approaches above is not the quality of the output. It is that there is nothing to send.
The dashboard is generated as HTML and published to a web server. The reader opens an address, much as they would open an intranet page. It is not an attachment, it is a publication.
The consequences are concrete. Only one version exists: no copies scattered across mailboxes, none forgotten on laptops. That version is refreshed in step with the report behind it, so nobody is reasoning on last month’s figures. And when an access no longer applies, the page is unpublished — there is no chasing attachments that have already been forwarded three times.
Access itself is a matter for your infrastructure: the server, the network, the authentication rules you apply to it. The same ones as for any other internal application.
The scope published is defined at generation time: you publish what the recipient needs, not the full detail. That leaves one decision to make up front — how to split publications by audience. It is the only real scoping work the method requires.
What an inventory usually reveals
When we carry out this inventory with a client, two figures almost always come as a surprise: how many people read the indicators without ever opening the platform, and how many scheduled exports go out every week to recipients nobody keeps a list of any more.
None of the four approaches described above is a mistake. They are reasonable answers to a real need. They have simply never been costed. And there is a fifth way, which avoids having to choose between reader convenience and control of your data.
Do you know what actually leaves your platform?
We run a half-day inventory: export volumes, recipients, and what is being distributed.
👉 Discover Need4Viz and what we really bring to SAP Web Intelligence
Need4Viz extends SAP Web Intelligence with advanced dataviz, interactivity, automation and AI capabilities to transform your reports into real decision-making tools.
Discover Need4Viz