


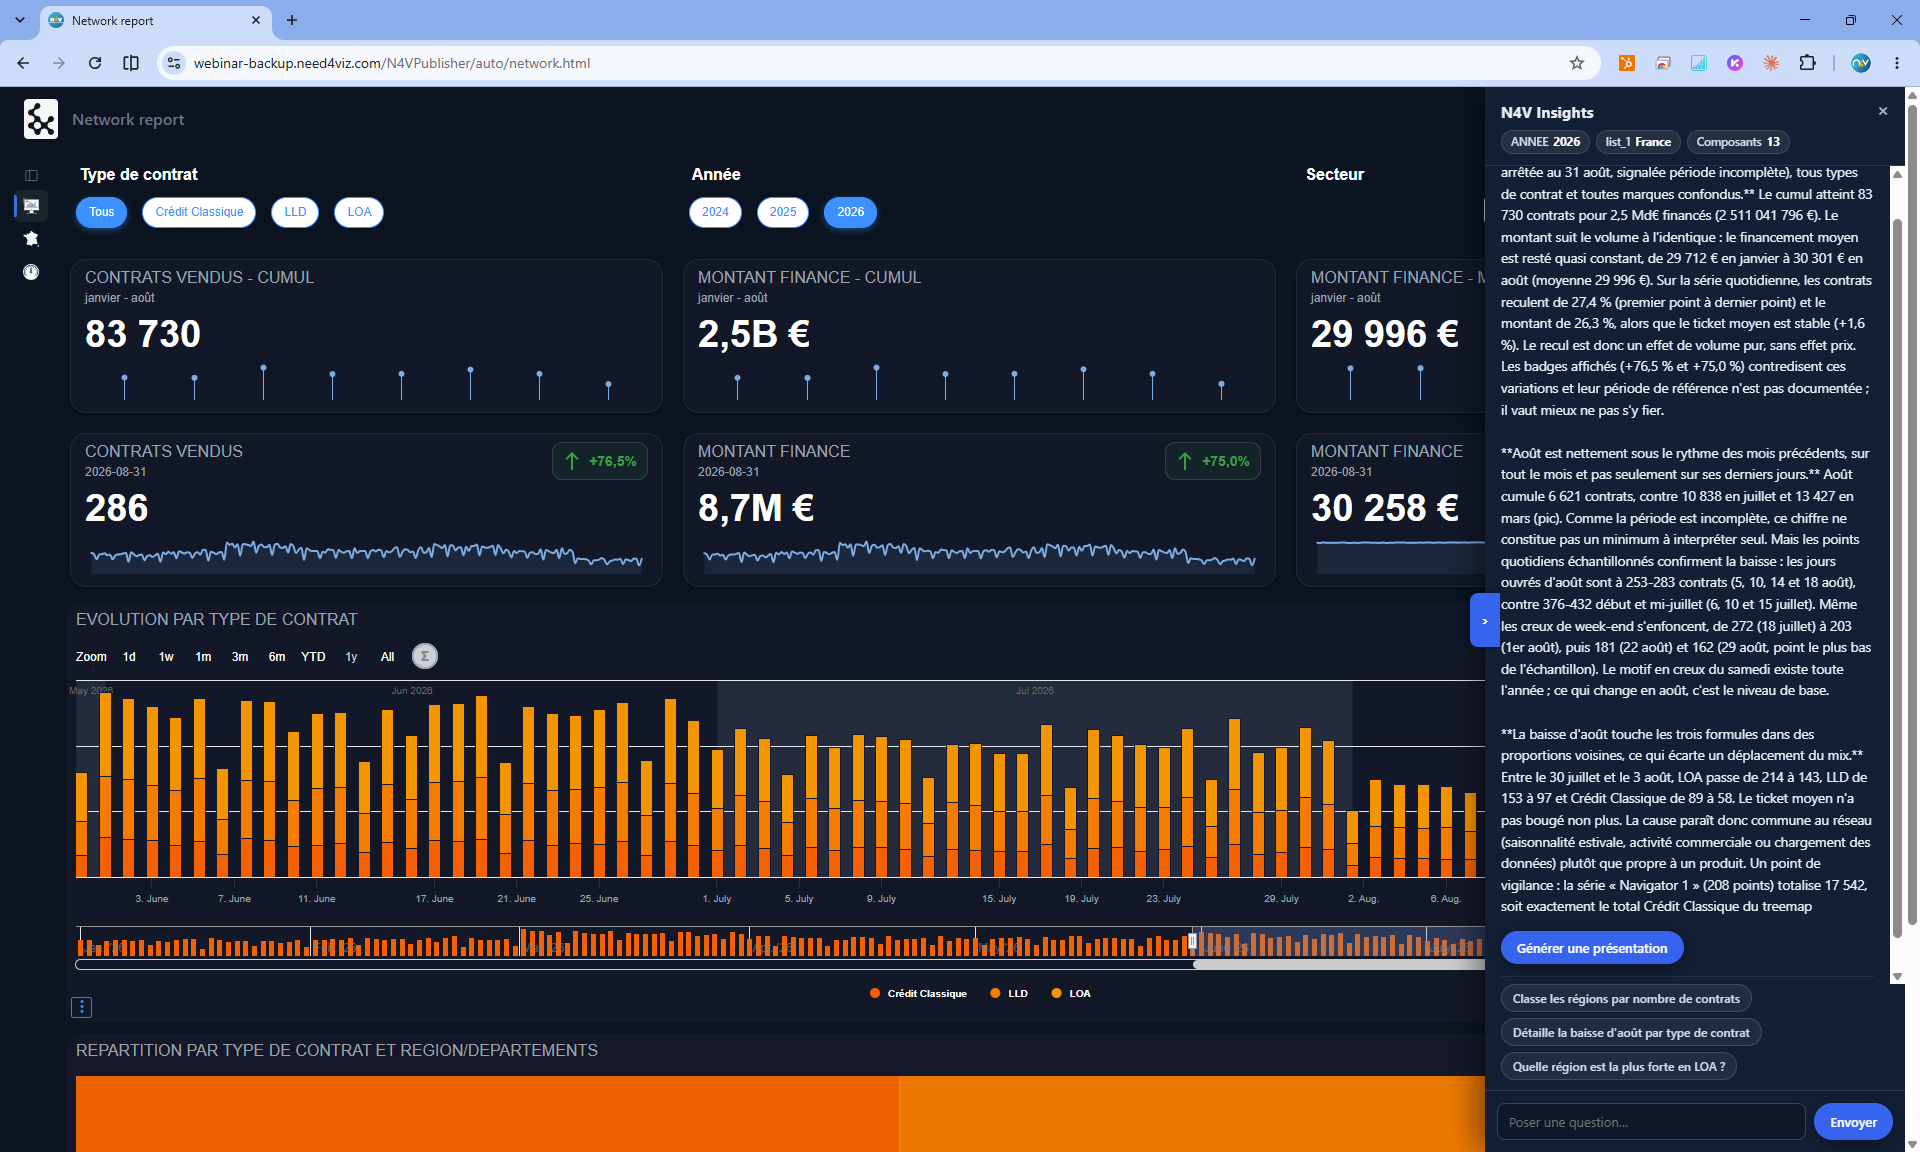
N4V FOR WEBI 2026.3 is now available. Highlights include a more mature N4V Dashboard Builder, the arrival of N4V Insights — AI that analyzes your dashboard —, many improvements to our widgets, and even more productive N4V panels. Here is an overview of what’s new.
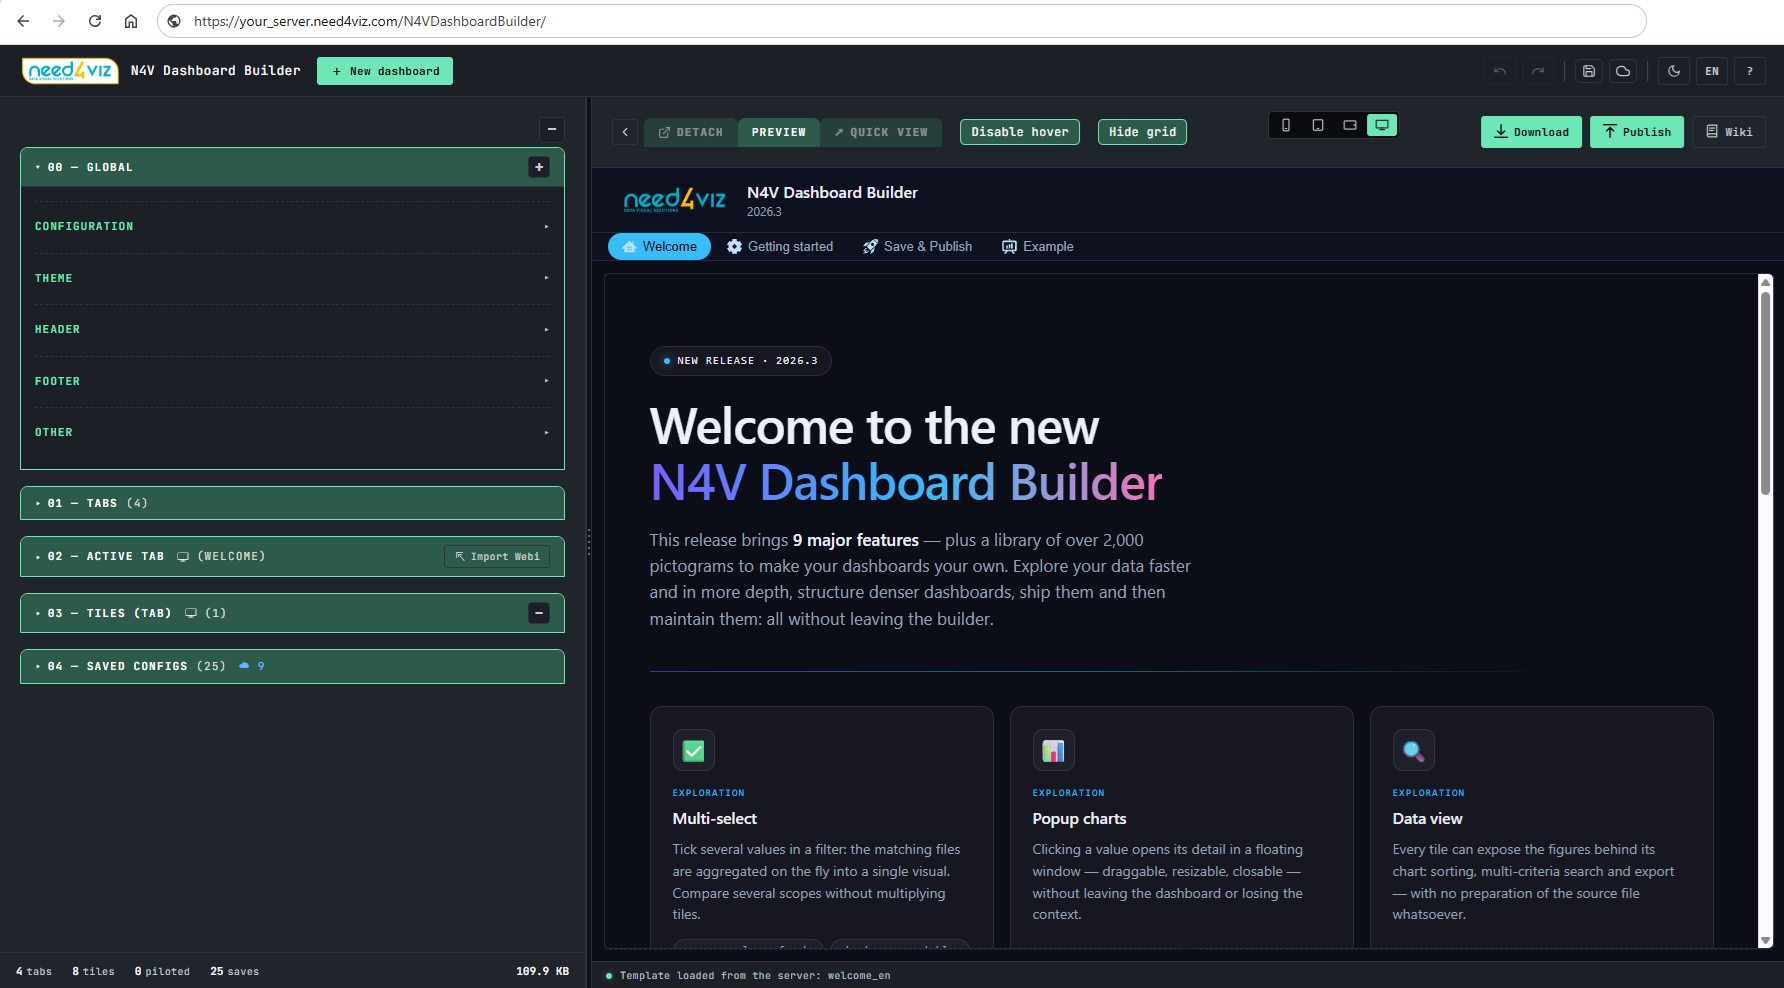
Enhanced N4V Dashboard Builder
Build your dashboard easily outside WebI
Introduced in release 2026.2, the N4V Dashboard Builder gains many new features. This 100% web application lets you build your dashboard with no code, from N4V widgets calculated in WebI.
- Easier for designers: external source and publishing, collaborative saving on the server, complete interactive dashboard documentation…
- More features for readers: sections, carousel tiles, PDF printing, multi-select N4V elements, pop-up charts, advanced data view…
New: N4V Insights
AI analyzes your dashboard
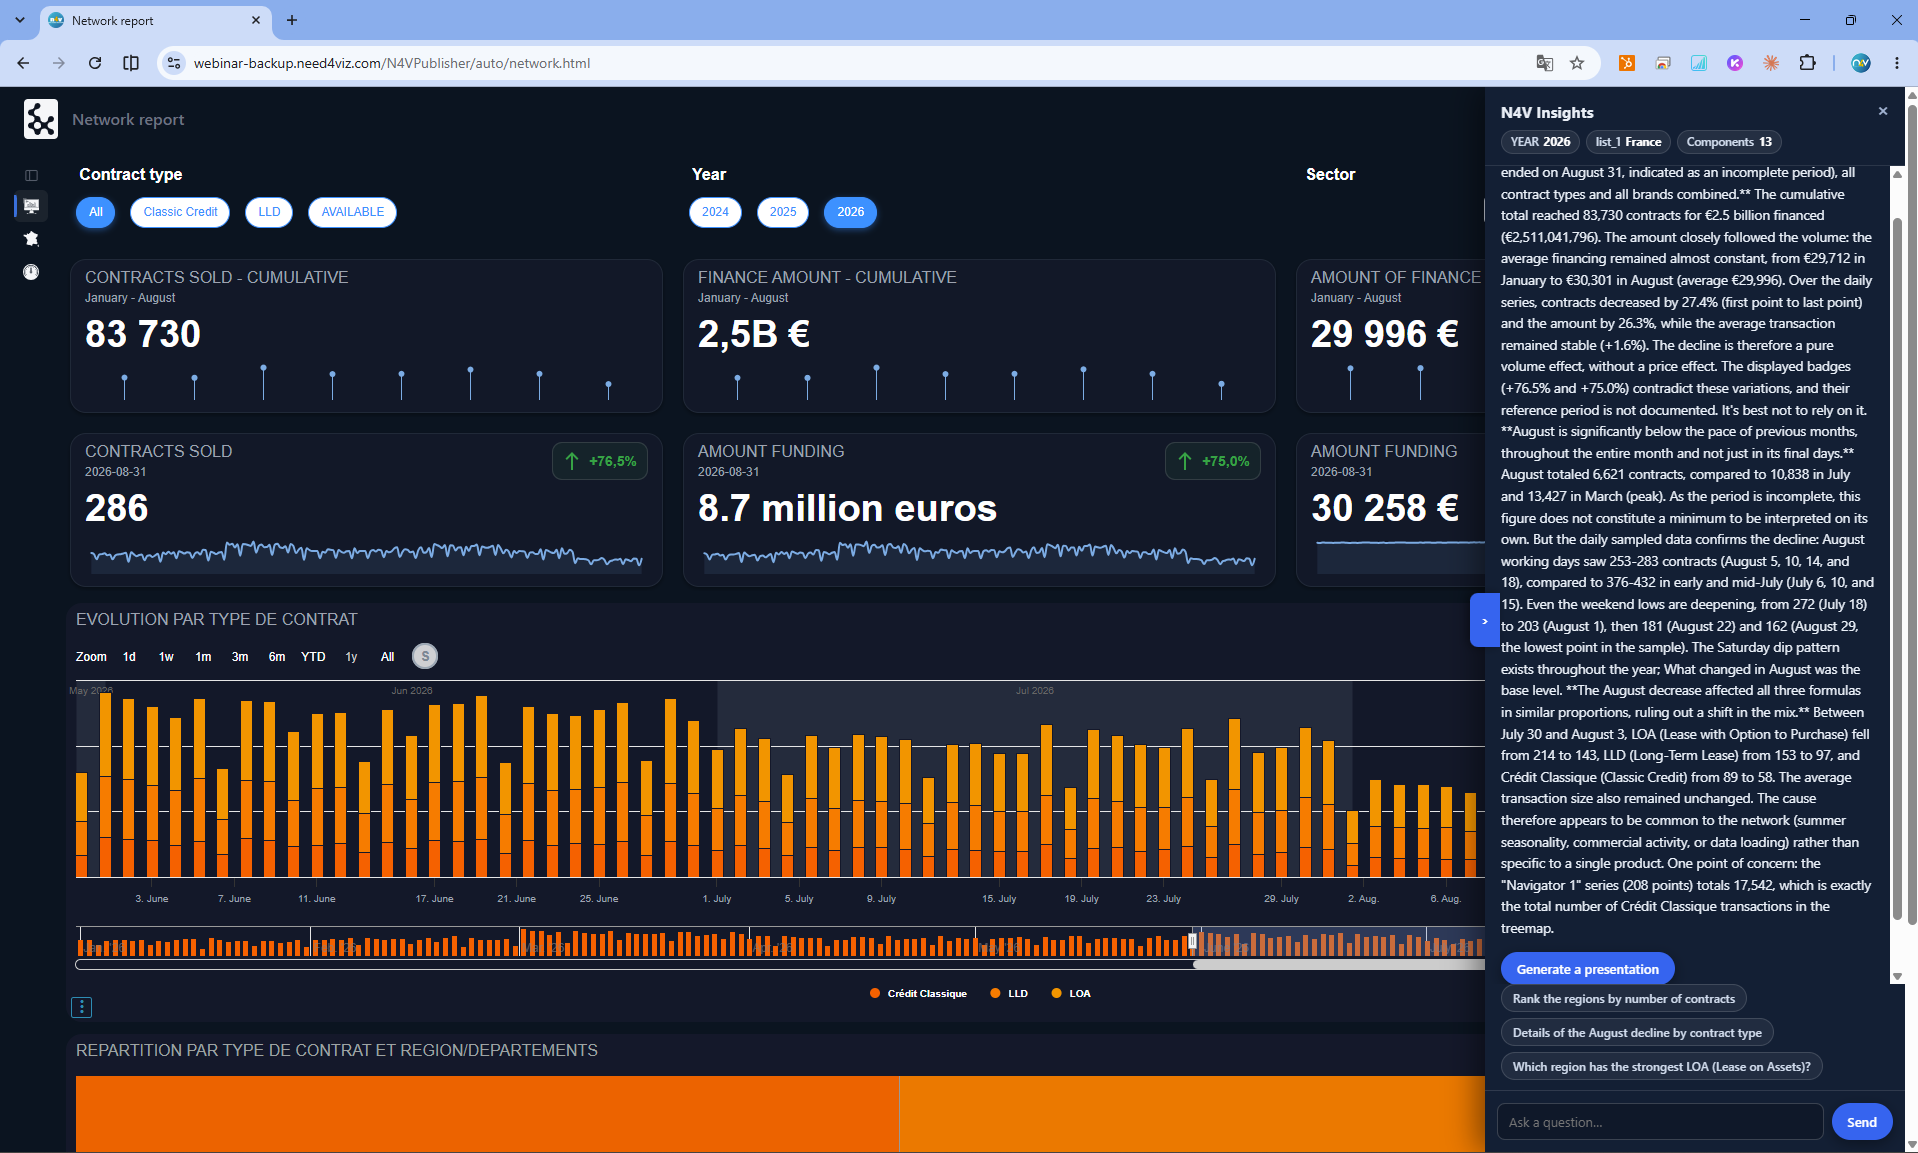
New in N4V Intelligence, N4V Insights analyzes every dashboard component, based on the applied filters.
- It writes a data-backed analysis: trends, breaks, gaps between indicators and points to watch.
- Suggested questions and free-text input let you dig deeper.
- Generate a presentation: N4V Insights creates a PowerPoint presenting the insights with the related charts.
Enhanced Widgets
Many improvements to our existing widgets
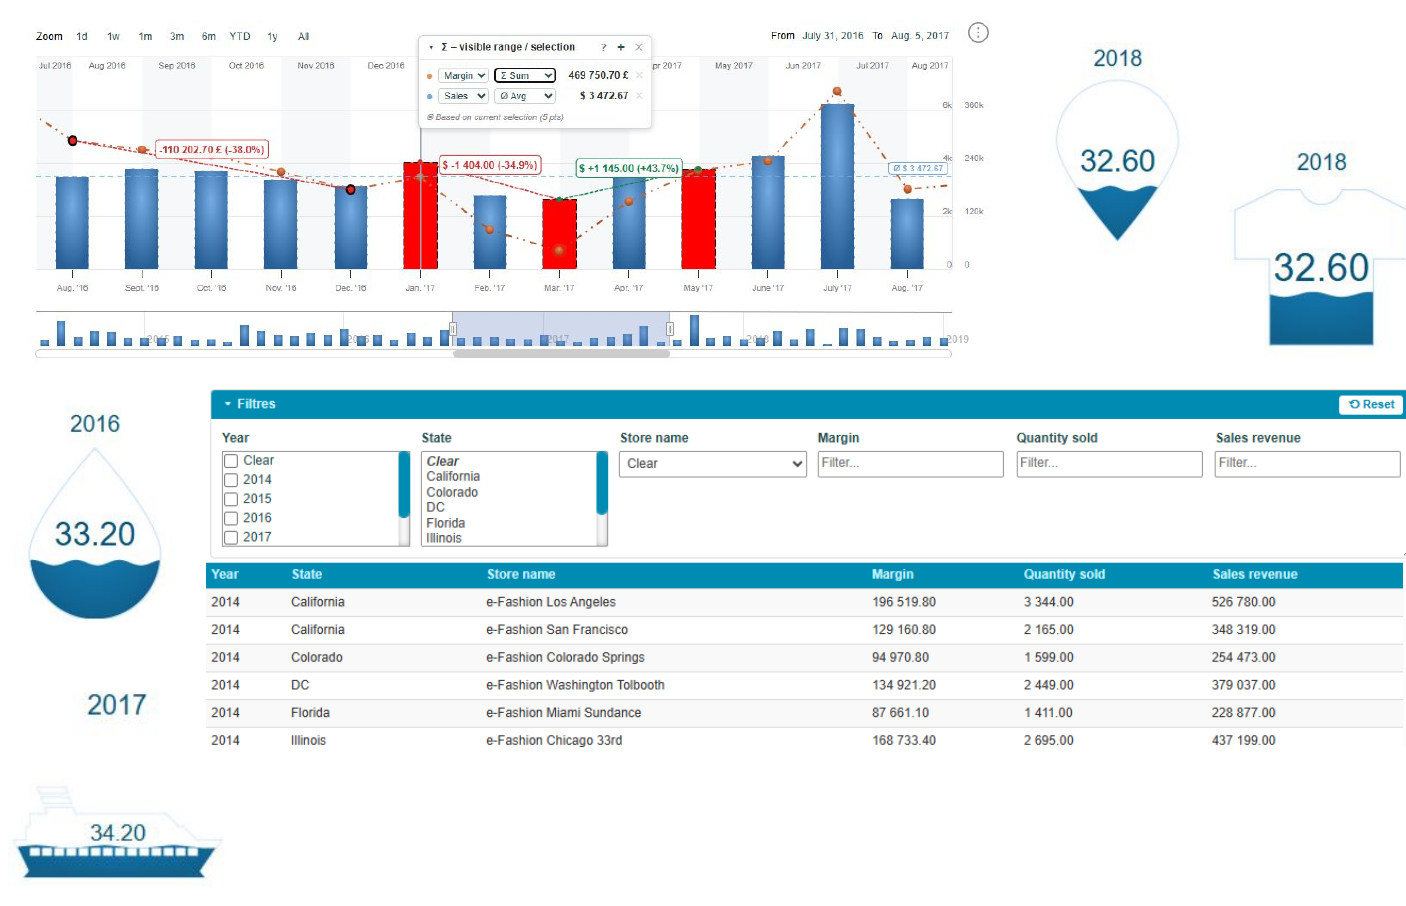
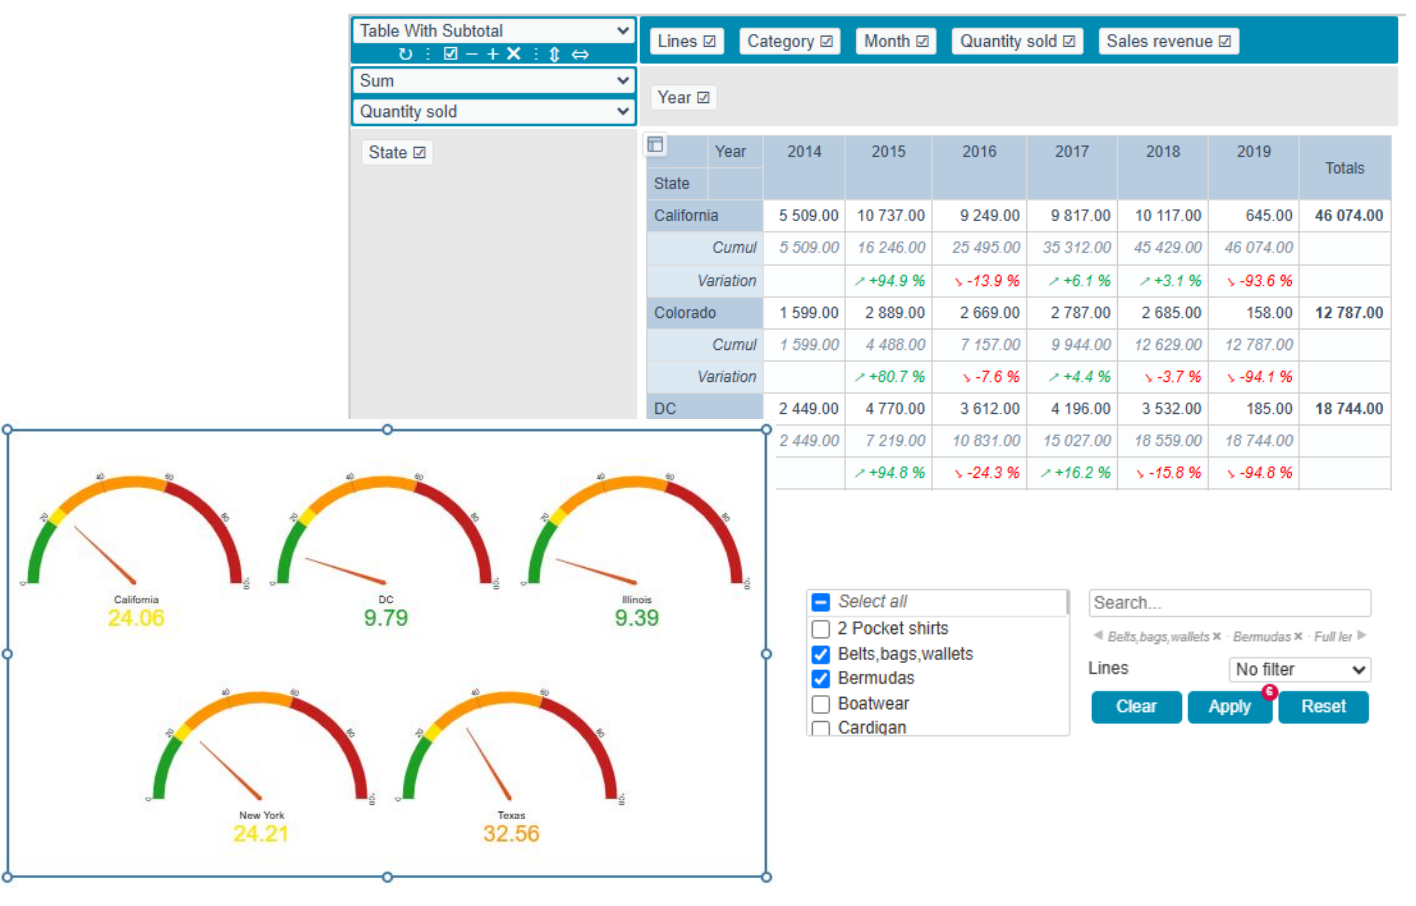
- Timeline: selecting several points displays the variance. A pop-up calculates several measure aggregations on the fly within the chosen zoom window (sum, min, max, avg…).
- Table filter: filters can be placed in an area above the table, and they are now nested by default.
- Liquid gauge: fully responsive, it can now take any custom shape (SVG).
- Pivot table: cumulative sum is available as an on-the-fly aggregation function and can also be shown on a separate row. The variance between points can also be shown on a row.
- Hemi Gauge: now fully responsive, it switches to “trellis” mode when there are several dimension values.
- Select Multi: the list now uses checkboxes, which are simpler and more intuitive. Search with multiple selection is now possible, and a summary line of the active selection is shown with a counter.
Enhanced N4V Panels
What’s new in the N4V panels
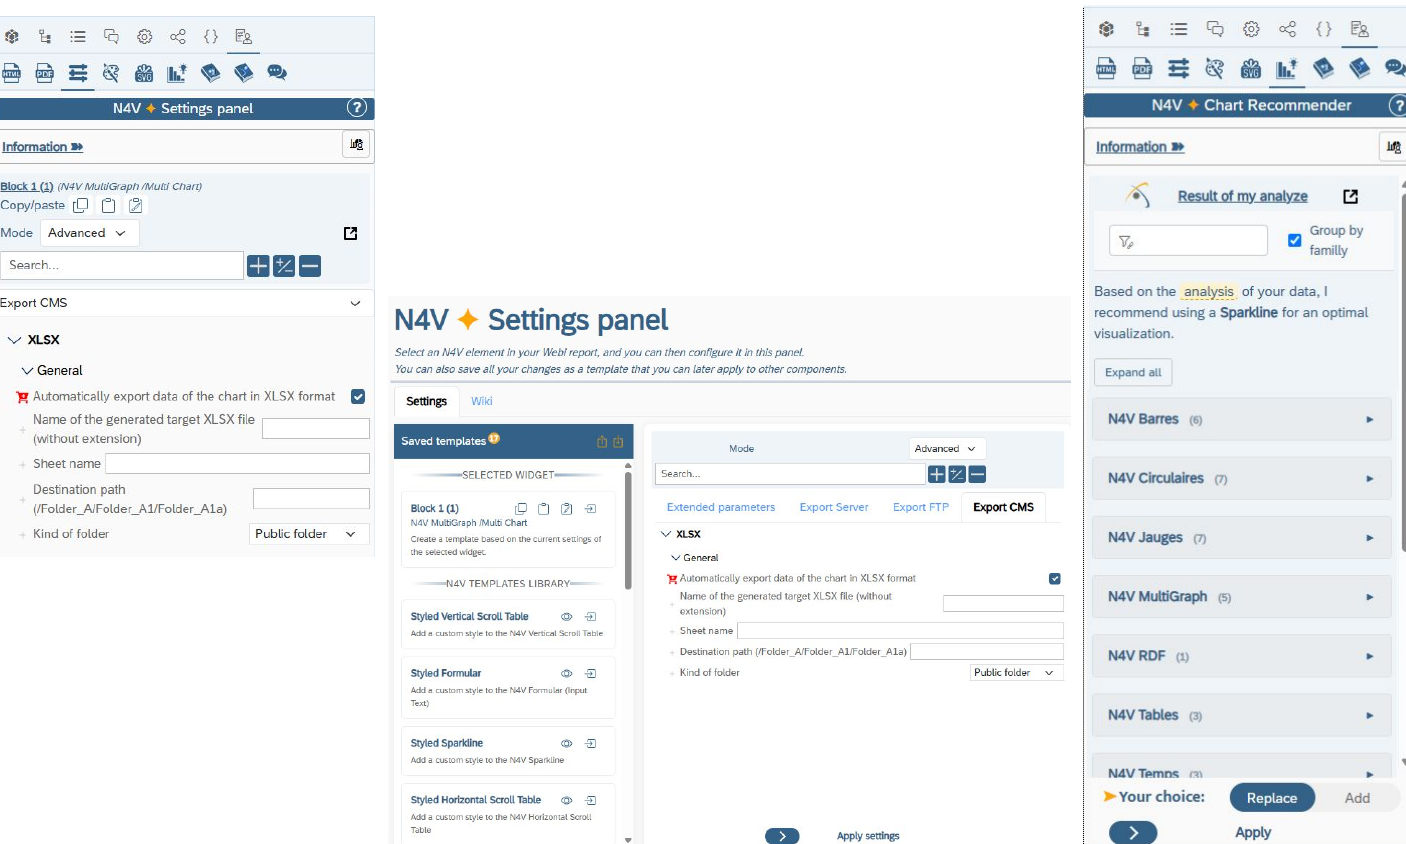
- The Settings panel shows the name and N4V family of the selected component.
- Copy / Paste / Paste style buttons copy all settings (or only the style) from one N4V component to others in one click.
- A template library changes the look of your N4V components in one click.
- A new export automatically sends the dataset as XLSX to a public or personal folder in the SAP BI CMS.
- The Chart Recommender can show components as a list or by family.
See the Wiki for the Full Report
Every enhancement and fix in release 2026.3 is detailed in our online documentation.
Full 2026.3 release notes | Download the presentation (PDF) | All release notes
2026 Roadmap: 2 Major Releases
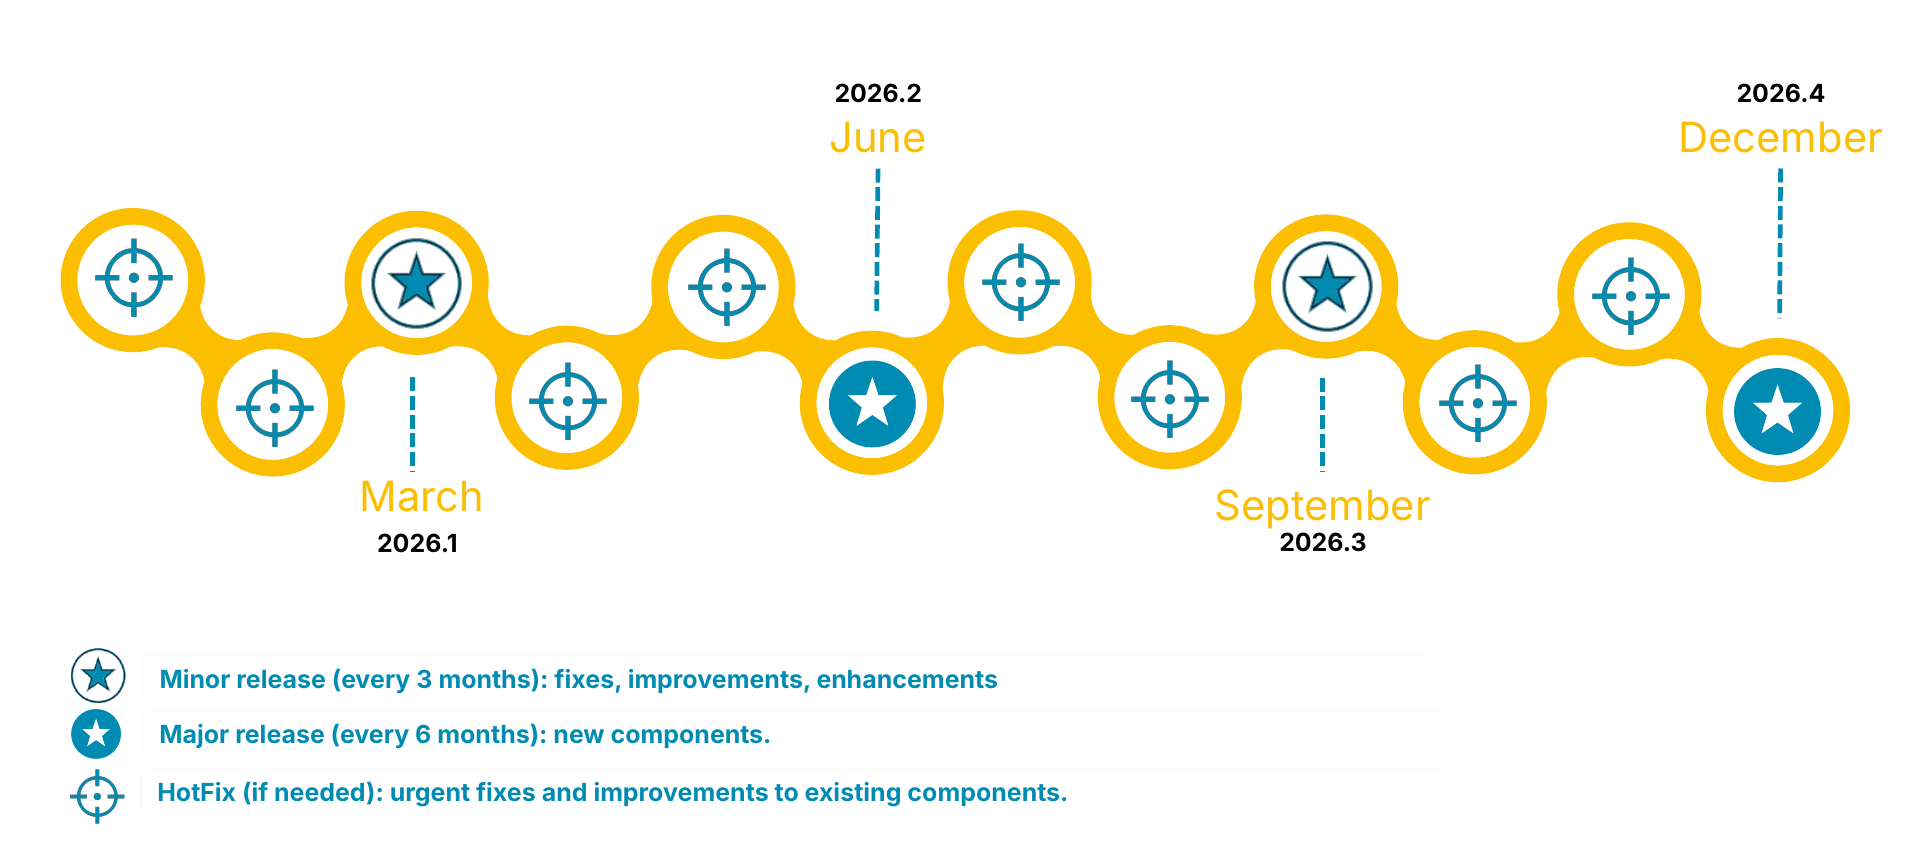
In 2026, Need4Viz keeps its delivery pace: 2 major releases (new components, in June and December) and 2 minor releases (fixes, improvements and enhancements, in March and September), complemented by HotFixes as needed. Next up: major release 2026.4, in December.
Questions about this release? Contact us.
👉 Discover Need4Viz and what we really bring to SAP Web Intelligence
Need4Viz extends SAP Web Intelligence with advanced dataviz, interactivity, automation and AI capabilities to transform your reports into real decision-making tools.
Discover Need4Viz