


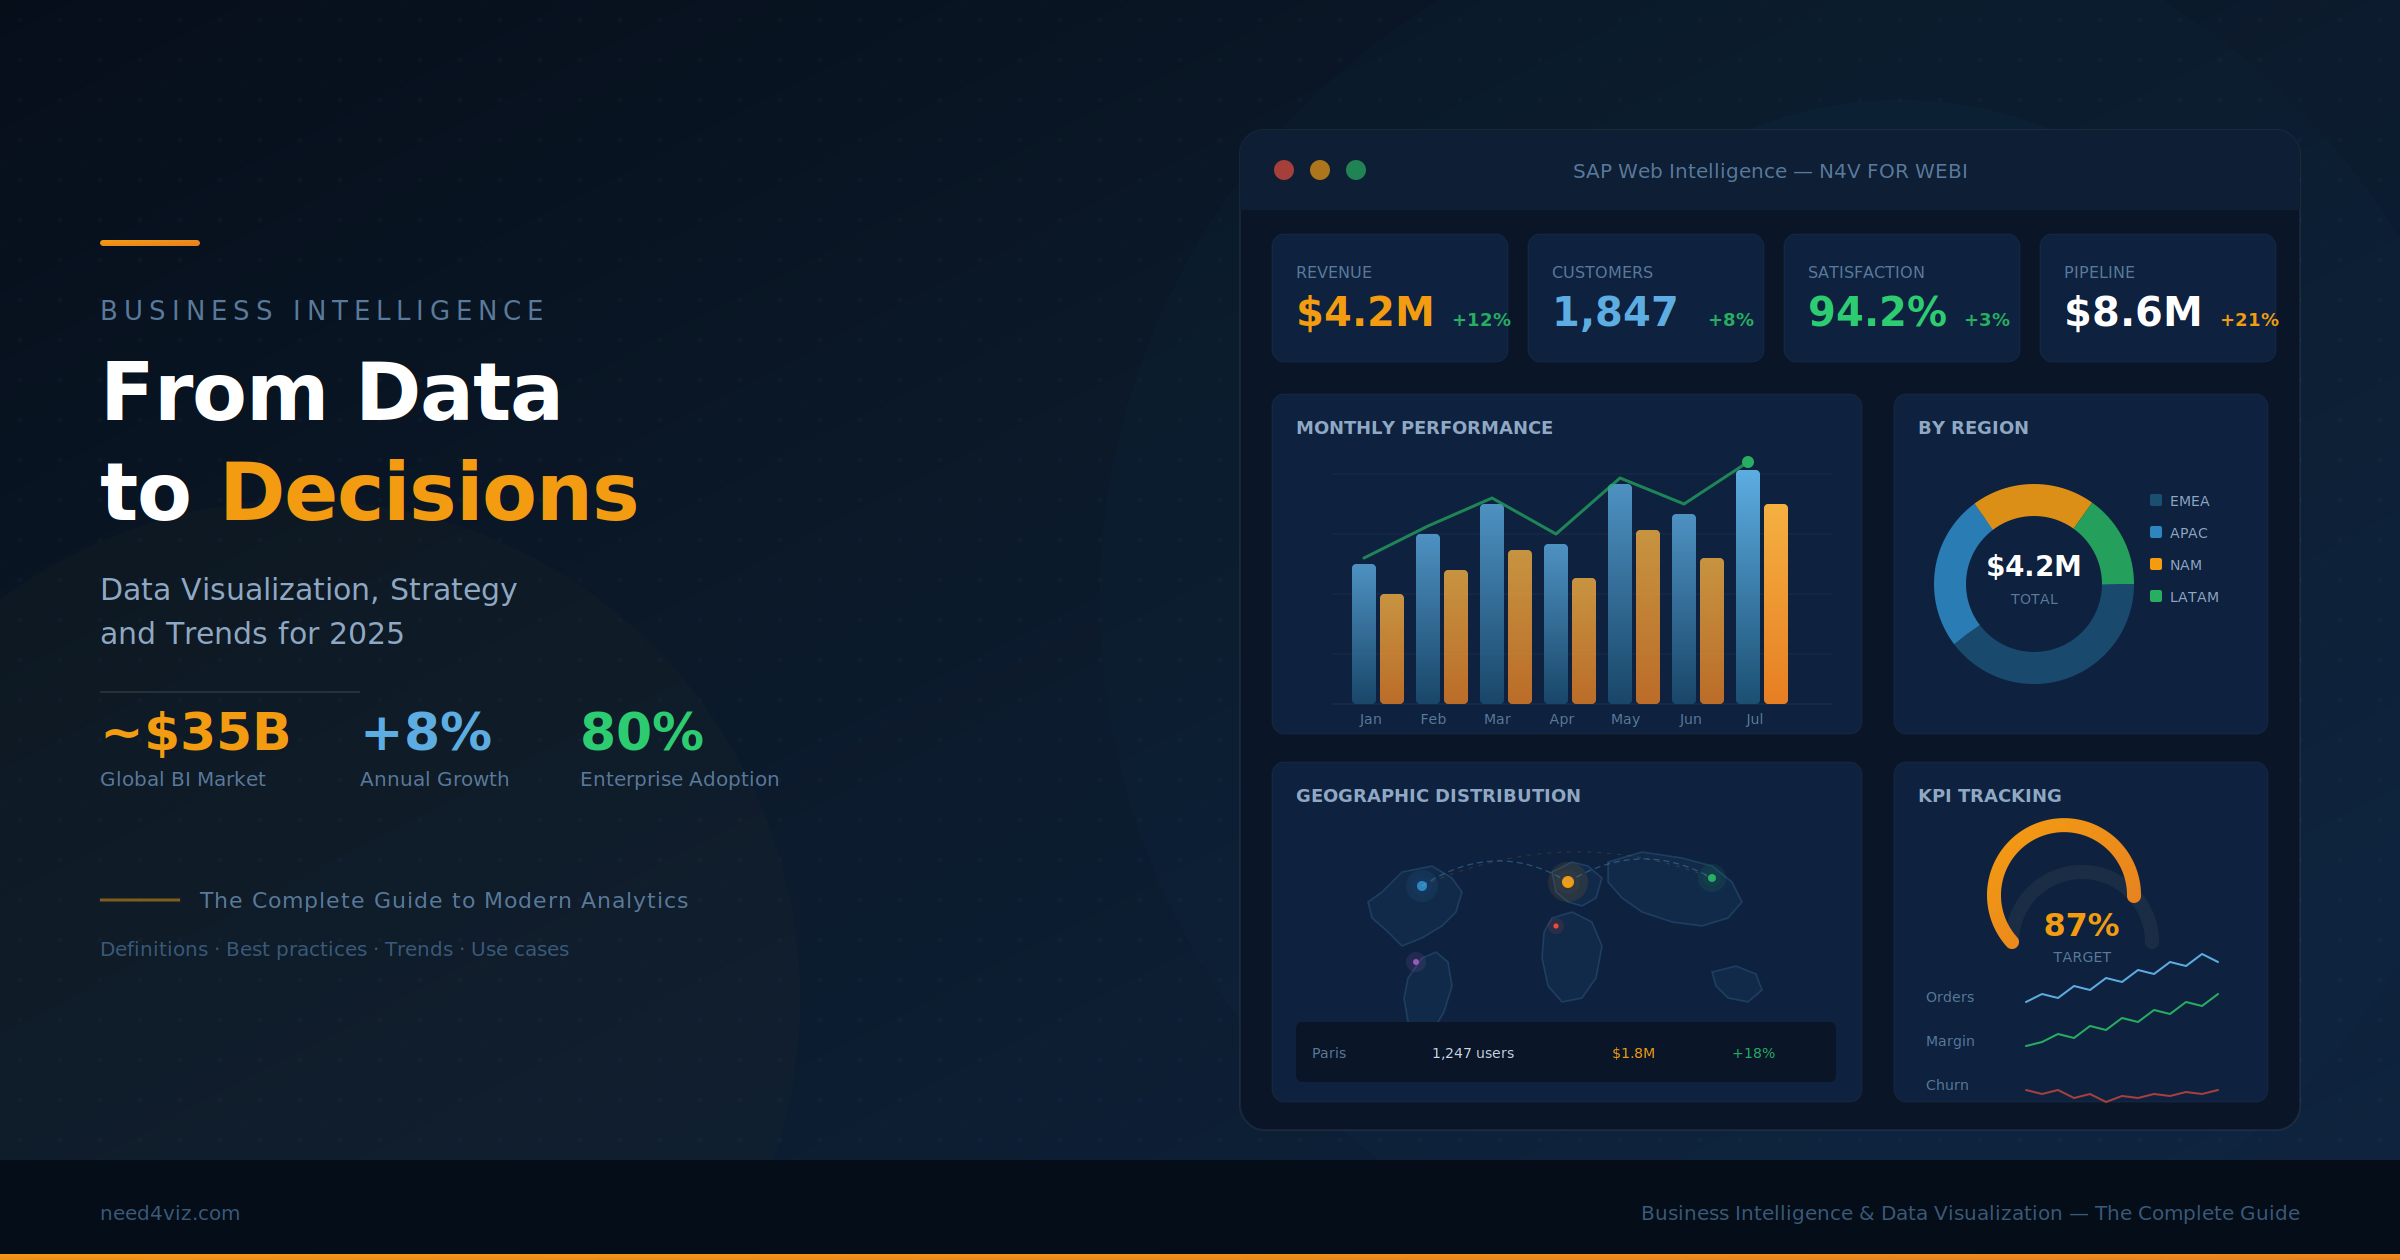
Data has become the fuel of organizational performance. But how do you go from raw data to informed decisions? That is precisely the mission of Business Intelligence and Data Visualization. This comprehensive guide covers definitions, challenges, trends and best practices for data-driven management — with real-world examples from SAP BusinessObjects and N4V FOR WEBI.
Table of Contents
- What is Business Intelligence?
- Data Visualization: Making Data Readable and Actionable
- The Strategic Challenges of BI for Organizations
- BI Use Cases by Industry
- 2025 Trends: The Future of Business Intelligence
- Making Your BI Project a Success: Best Practices
- BI, Big Data and Advanced Analytics: What Are the Differences?
- Why SAP BusinessObjects and N4V FOR WEBI?
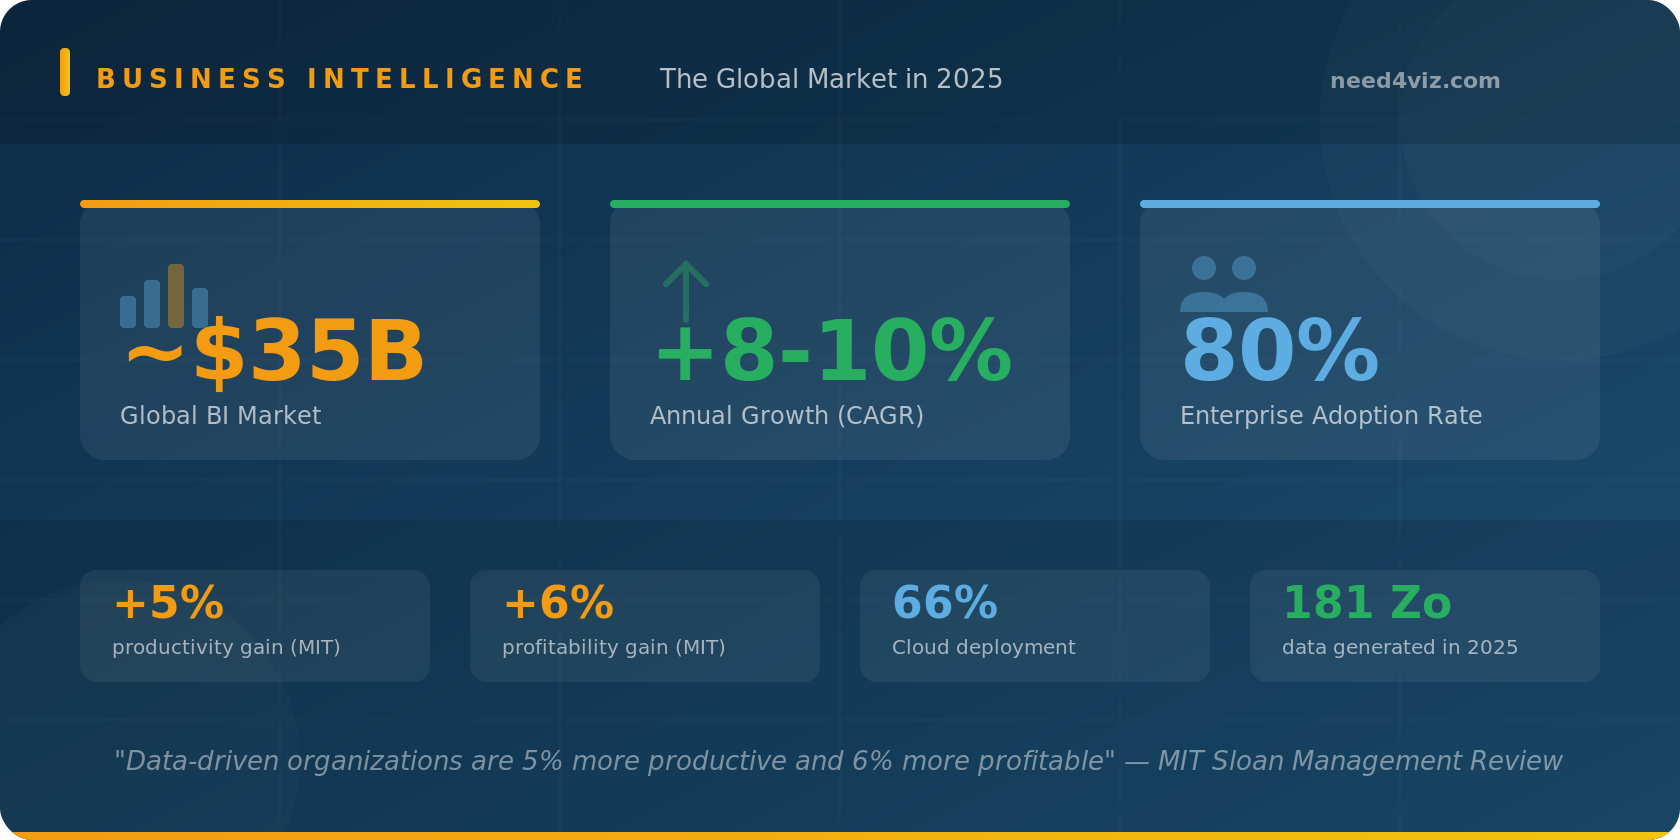
In a world where data volumes are exploding and decisions need to be made faster than ever, Business Intelligence (BI) has become a major strategic lever for organizations of all sizes and sectors. The global BI market is estimated at approximately $35 billion in 2025, with sustained annual growth of 8 to 10%. According to a study by the MIT Sloan Management Review, data-driven companies are on average 5% more productive and 6% more profitable than their competitors.
More than ever, BI and Data Visualization are at the heart of organizational challenges — driving precision, steering and information sharing, in the pursuit of strategic alignment.
1. What is Business Intelligence?
Definition and Scope
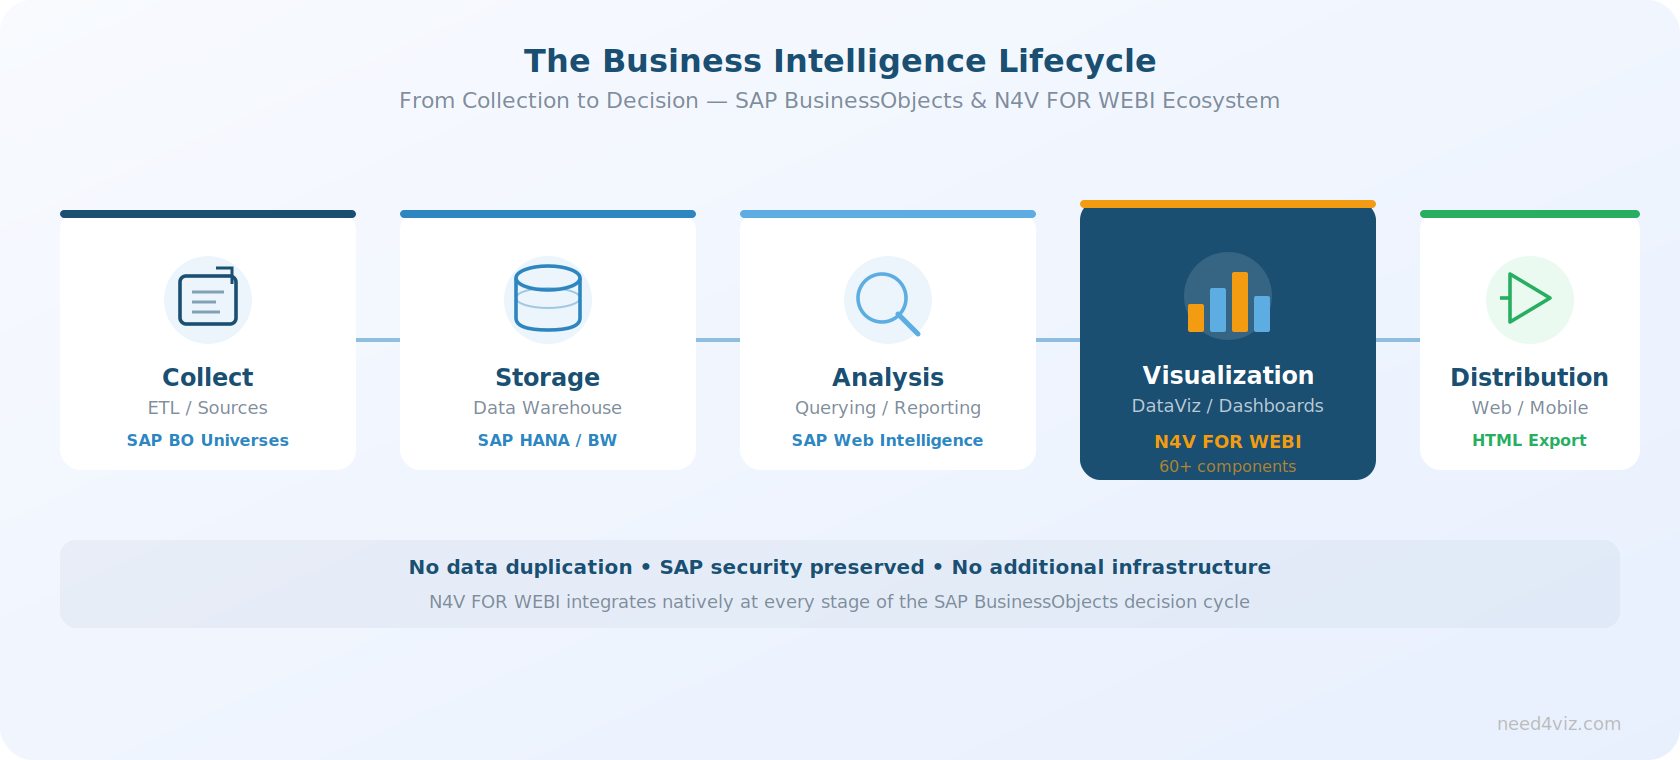
Business Intelligence refers to the set of technologies, processes and practices that enable organizations to collect, integrate, analyze and present data to improve understanding and decision-making. In practical terms, BI transforms heterogeneous data — from databases, ERP systems, CRMs, flat files and business applications — into dashboards, reports and visualizations that make information intelligible and actionable.
BI is not a single tool or technology. It is an ecosystem that covers the entire data lifecycle, from extraction to delivery to business users, including storage, processing and quality management.
Key Components of BI
| Component | Role | Real-World Example |
|---|---|---|
| Collection / Integration (ETL) | Extract and consolidate data from multiple sources | SAP BusinessObjects Universes, database connections |
| Data Warehouse | Store structured data for analysis | SAP HANA, BW/4HANA |
| Semantic Layer | Translate technical data into business language | UNX Universes in SAP BO |
| Reporting & Querying | Create parameterized reports and ad hoc queries | SAP Web Intelligence (Webi) |
| Data Visualization | Represent data as interactive graphics | N4V FOR WEBI (60+ components) |
| Advanced Analysis | Explore, correlate, predict | N4V Data Analyzer, predictive analytics |
| Distribution & Collaboration | Share insights at the right time, in the right format | HTML export, web portals, SAP BO publications |
Historical Evolution: From Traditional to Modern BI
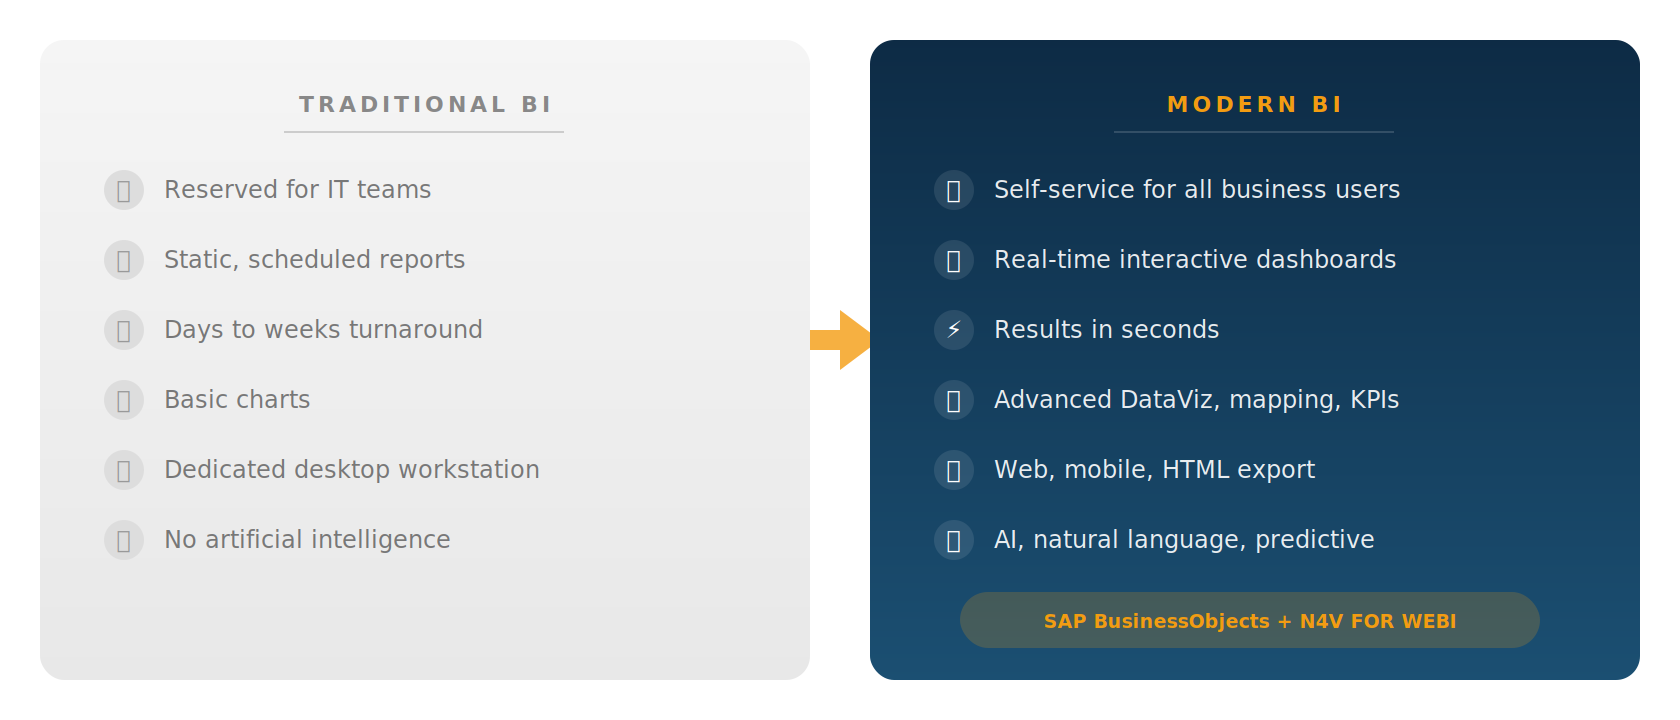
Business Intelligence has evolved significantly since its origins in the 1960s. Initially reserved for IT teams producing static reports on demand, it has progressively democratized to become a tool that directly serves business users.
| Criterion | Traditional BI | Modern BI |
|---|---|---|
| Primary User | IT Team / CIO | Business users (self-service) |
| Report Type | Static, scheduled | Interactive, real-time |
| Time to Insight | Days to weeks | Minutes to seconds |
| Visualization | Basic tables and charts | Advanced DataViz, maps, dynamic KPIs |
| Accessibility | Dedicated workstation | Web, mobile, portals, HTML export |
| Artificial Intelligence | None | Built-in AI, natural language, recommendations |
Real-World Example: SAP BusinessObjects + N4V FOR WEBI
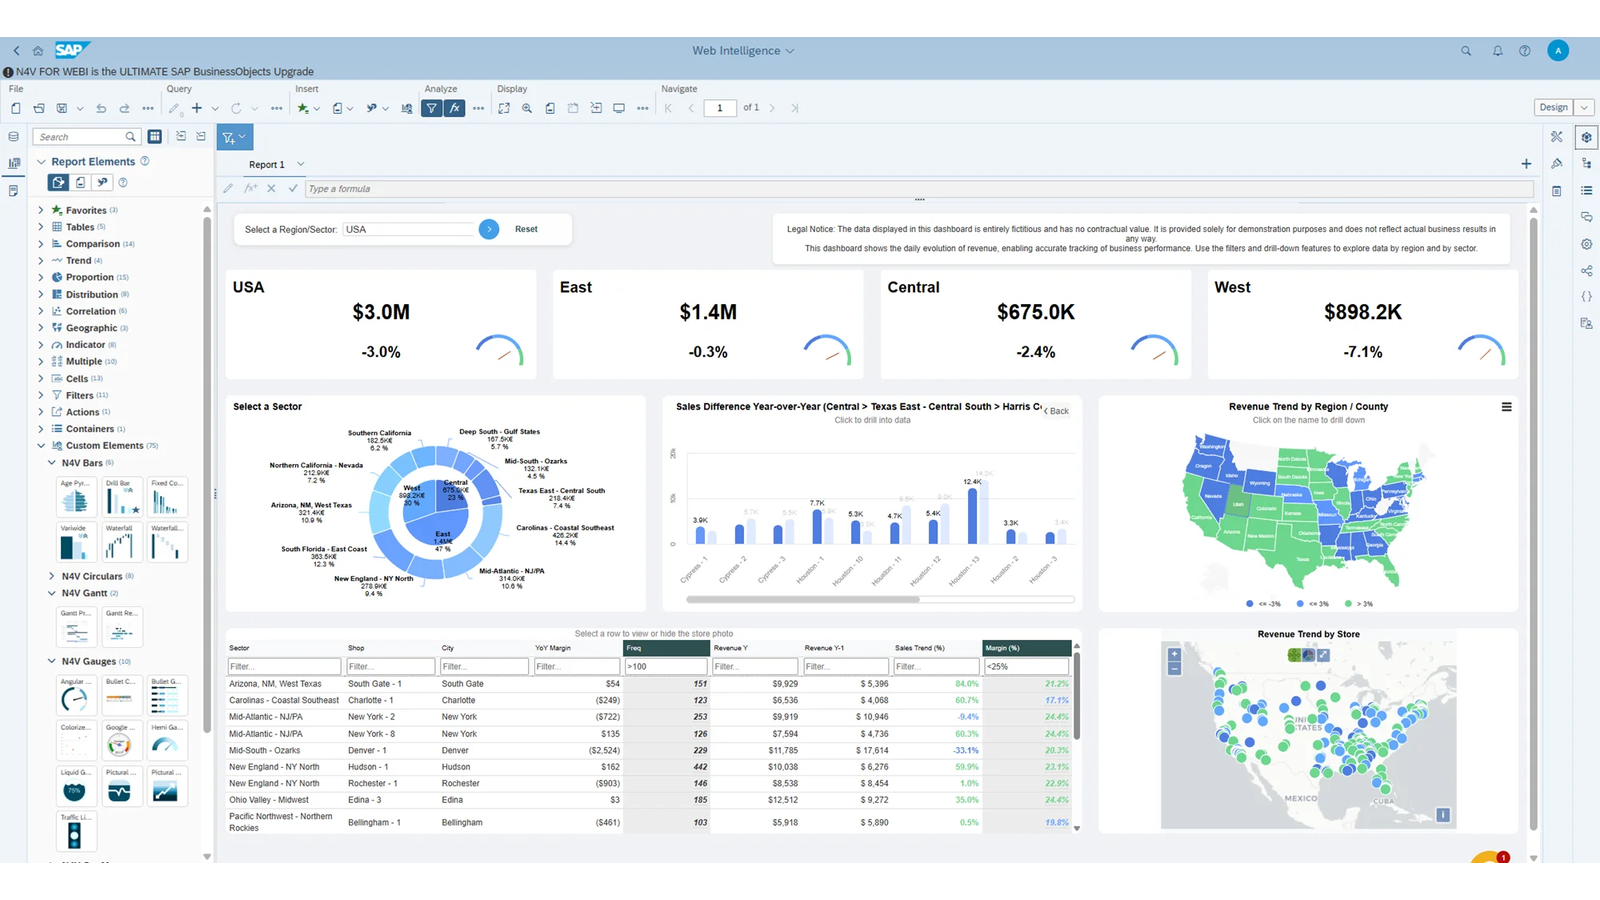
SAP BusinessObjects Web Intelligence is one of the most widely deployed reporting tools in the world. With N4V FOR WEBI, organizations take the leap to modern BI: over 60 interactive visualization components, integrated mapping, dynamic dashboards and HTML export — all without changing infrastructure or data models.
2. Data Visualization: Making Data Readable and Actionable
Why Visualize Data?
The human brain processes visual information 60,000 times faster than text. Data Visualization harnesses this natural ability to transform complex datasets into immediately understandable graphical representations. A well-designed chart reveals trends, anomalies and correlations that columns of numbers cannot convey.
DataViz is not just about making things look pretty. It serves decision-making effectiveness: a well-designed dashboard allows a decision-maker to grasp the state of a business activity in seconds, identify areas of concern and take action.
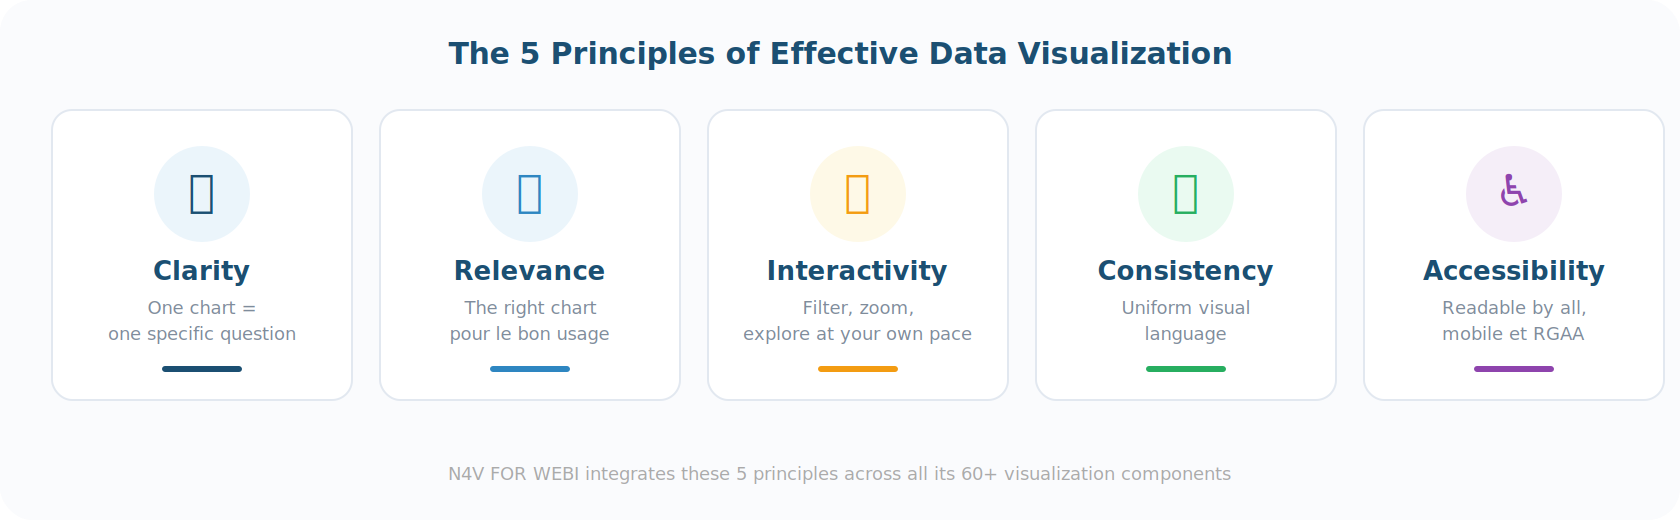
The 5 Principles of Effective Data Visualization
The Fundamentals
1. Clarity — Each chart should answer a specific question. Avoid information overload.
2. Relevance — Choose the right chart type based on the nature of the data (comparison, evolution, distribution, relationship).
3. Interactivity — Allow users to filter, zoom and navigate to explore data at their own pace.
4. Consistency — Use a uniform visual language (colors, fonts, layouts) to facilitate reading.
5. Accessibility — Ensure visualizations are readable by everyone, including on mobile devices and for people with disabilities.
Visualization Types and Their Uses
| Chart Type | Primary Use | N4V FOR WEBI Availability |
|---|---|---|
| Advanced bars & histograms | Category comparison, rankings | ✓ Stacked, grouped, waterfall bars |
| Lines & areas | Time evolution, trends | ✓ Sparklines, multi-axis curves |
| Pies & donuts | Distribution, market share | ✓ Advanced pie, variable pie |
| Gauges & KPIs | Real-time indicator tracking | ✓ Animated gauges, KPI tiles, chart tiles |
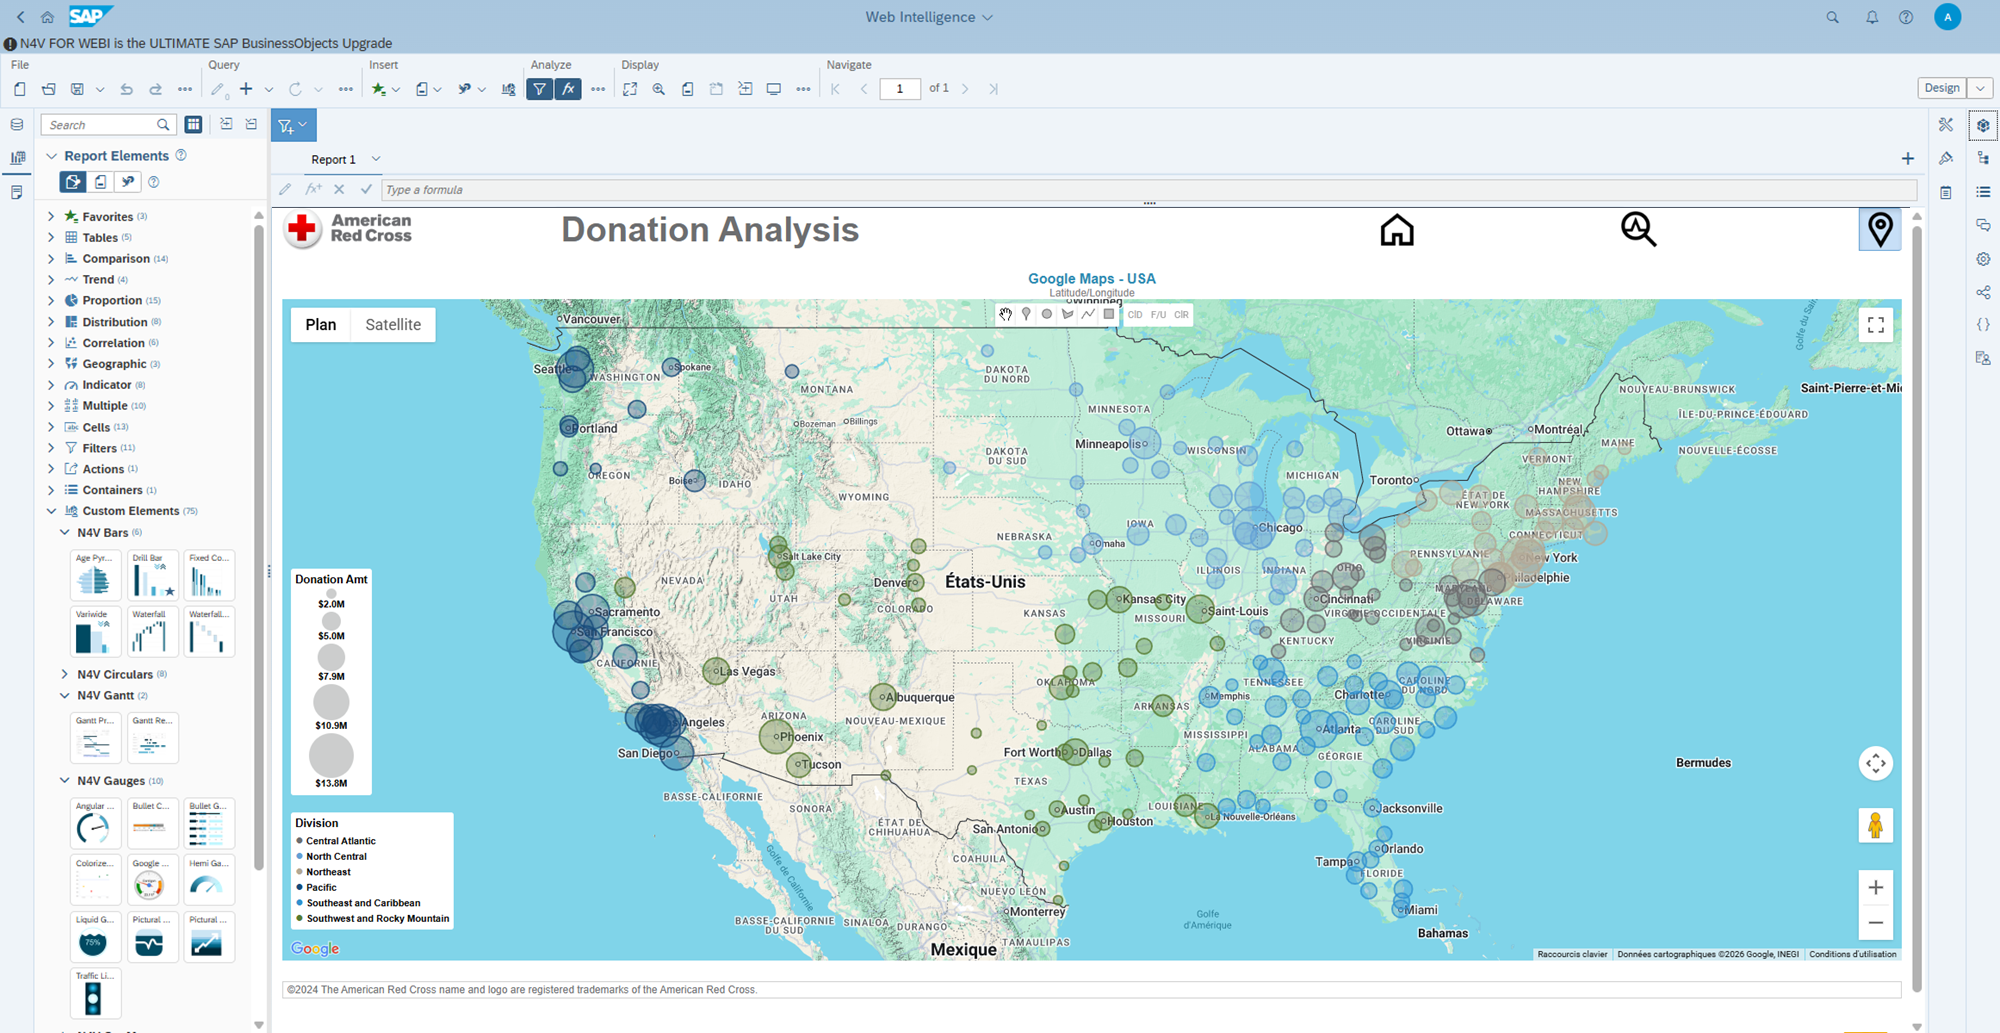
| Geographic maps | Spatial analysis, territorial distribution | ✓ Google Maps, OpenStreetMap, offline maps |
| Interactive tables | Data detail, filtering, pagination | ✓ Filterable, scrollable, sortable tables |
| Timelines & sliders | Time navigation | ✓ Timeline, period slider |
| Bubbles & treemaps | Multidimensional analysis | ✓ Drillable bubble charts, treemaps |
With N4V FOR WEBI: A Library of Over 60 Components
N4V FOR WEBI offers the most comprehensive visualization library on the market for SAP BusinessObjects Web Intelligence. Each component is natively integrated into the Webi interface, requires no code and can be configured in just a few clicks. Business users gain autonomy while staying in their familiar environment.
3. The Strategic Challenges of BI for Organizations
Data-Driven Management: The Data Culture
Adopting a Business Intelligence approach means first and foremost establishing a data culture within the organization. This requires that every employee, from the front line to the C-suite, can access relevant information to make informed decisions within their scope of action.
Data-driven organizations share several common characteristics: structured data governance, defined and tracked KPIs, dashboards accessible at all levels of the hierarchy, and the ability to quickly transform insights into concrete actions.
The Tangible Benefits of BI
Accuracy
Reduce errors by relying on facts rather than intuition. Detect anomalies and deviations in real time.
Steering
Track KPIs continuously, identify trends and adjust strategy accordingly. Move from retrospective reporting to proactive management.
Sharing
Distribute information in the right format, at the right time, to the right people. Foster transparency and collaboration.
Strategic Alignment
Ensure every team works with the same benchmarks and objectives. Create a shared vision of performance.
Key Challenges
Despite its obvious benefits, implementing a BI strategy comes with significant challenges. Data quality remains the primary factor of success or failure: incomplete, outdated or inconsistent data compromises the reliability of any analysis. User adoption is another major challenge: tools must be intuitive enough to be used daily by non-technical users.
Finally, data governance and regulatory compliance (GDPR, industry directives) impose a rigorous framework for security, traceability and personal data protection.
The N4V FOR WEBI Approach to These Challenges
By natively integrating into SAP BusinessObjects, N4V FOR WEBI leverages existing infrastructure and security. No data duplication, no new database to maintain, no heavy training. Users stay in their familiar environment while gaining access to significantly enhanced visualization and analysis capabilities.
4. BI Use Cases by Industry
Business Intelligence applies to every industry and every business function. Here are some concrete examples of the value BI delivers in different contexts.
| Industry | BI Use Case | N4V / SAP BO Application Example |
|---|---|---|
| Public Sector | Budget management, policy monitoring, open data | Citizen-facing dashboards with accessible HTML export (WCAG compliance) |
| Healthcare | Hospital activity tracking, patient flow management, quality indicators | Automated dashboards feeding the hospital intranet via N4V FOR WEBI |
| Manufacturing | Production monitoring, predictive maintenance, quality control | Real-time production KPIs with gauges and factory maps |
| Finance & Banking | Risk management, fraud detection, regulatory reporting | Enriched Webi reports with N4V multidimensional analyses |
| Retail | Sales analysis, inventory optimization, customer behavior | Geographic performance maps by catchment area |
| Transport & Logistics | Route optimization, fleet tracking, logistics costs | Flow mapping with Mapline and trend analysis |
Case Study: Chantiers de l’Atlantique
Building the world’s largest cruise ships requires absolute precision in management. Chantiers de l’Atlantique transformed their SAP BusinessObjects reporting with N4V FOR WEBI, moving from static reports to interactive dashboards that provide real-time visibility into key production indicators.
Use Case: Département du Var — Social Benefits Management
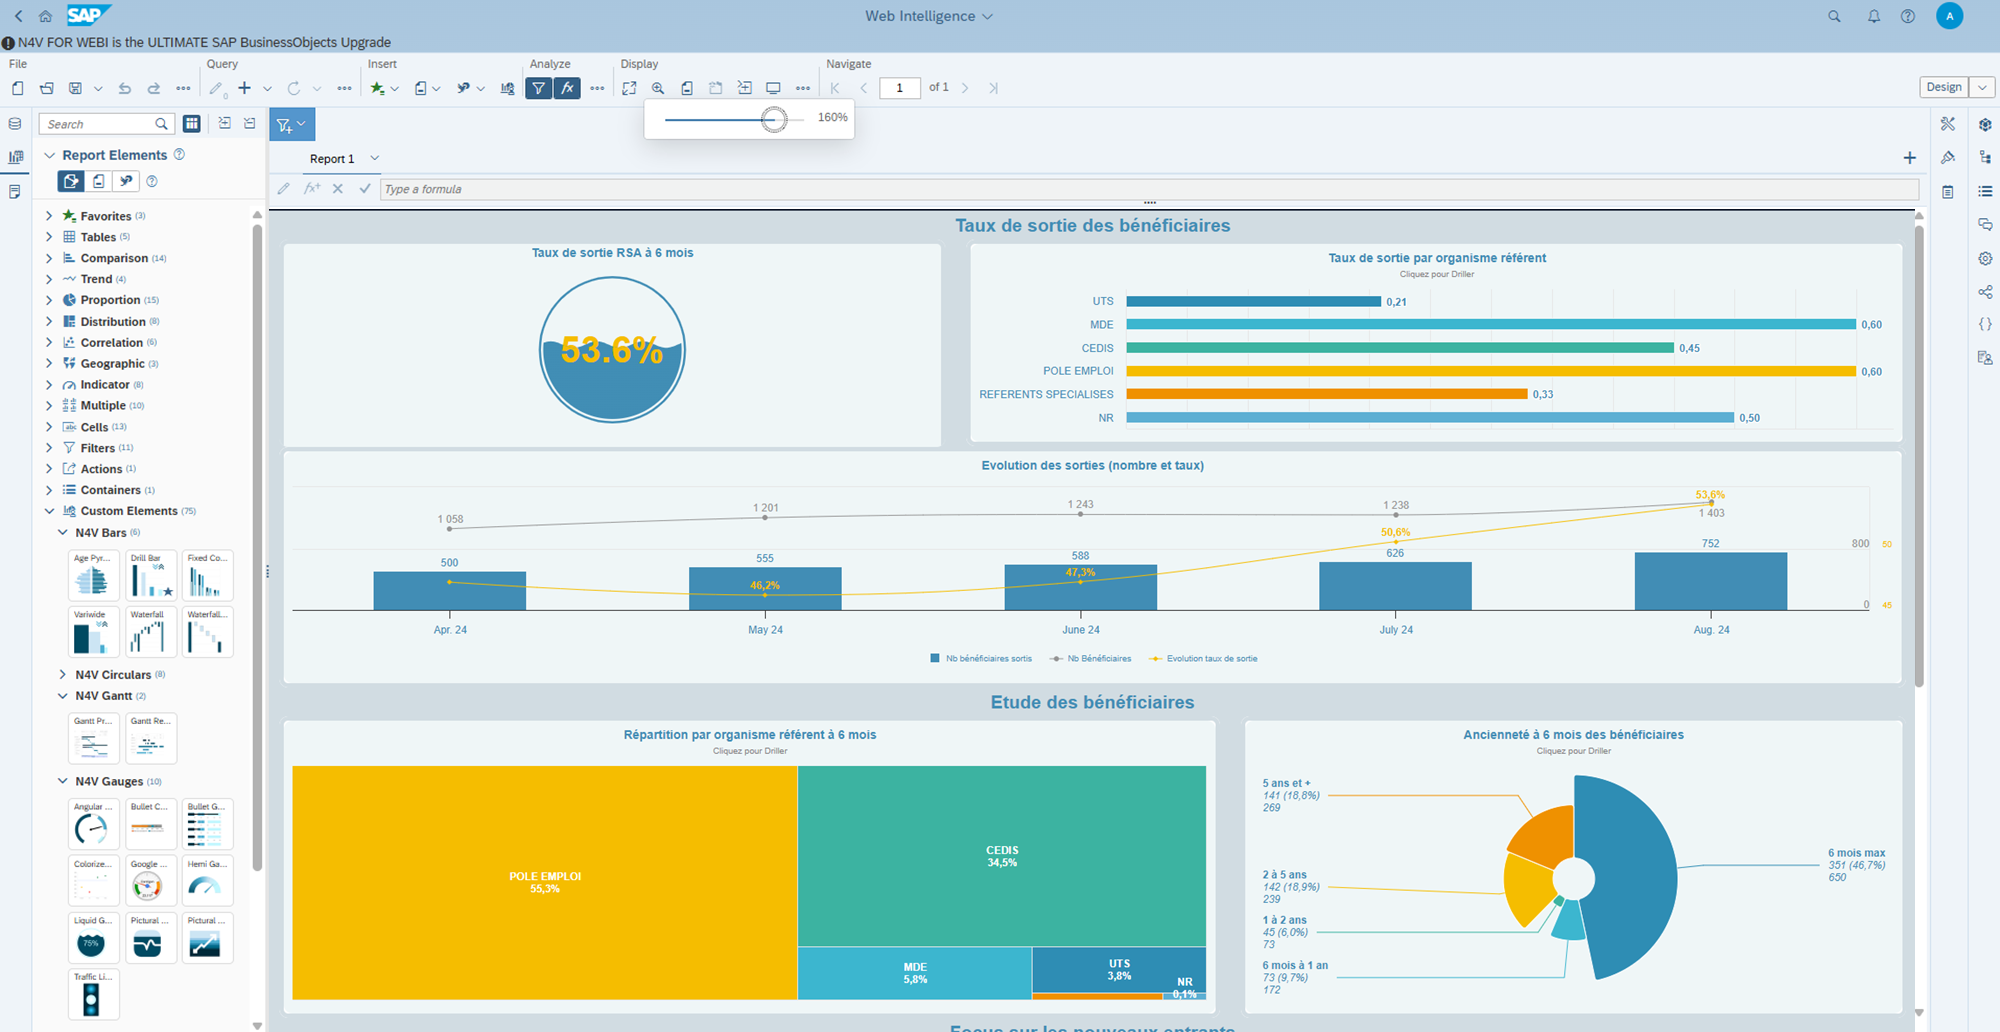
The Département du Var uses N4V FOR WEBI to manage social benefits tracking through interactive dashboards integrated with SAP BusinessObjects. Mapping of beneficiaries by territory, entry and exit flow trends, tracking indicators by agent: teams have a consolidated, up-to-date view directly accessible from their browser via HTML export — without additional SAP BO licenses for business users.
5. 2025 Trends: The Future of Business Intelligence
Artificial Intelligence at the Heart of BI
The integration of artificial intelligence into BI platforms is arguably the most transformative trend of recent years. AI automates data preparation, detects anomalies, generates forecasts and provides contextual recommendations. Most importantly, it democratizes access to analysis through natural language: users can ask questions in plain English (or their own language) and instantly receive relevant visualizations.
N4V Intelligence: AI at the Service of SAP Webi
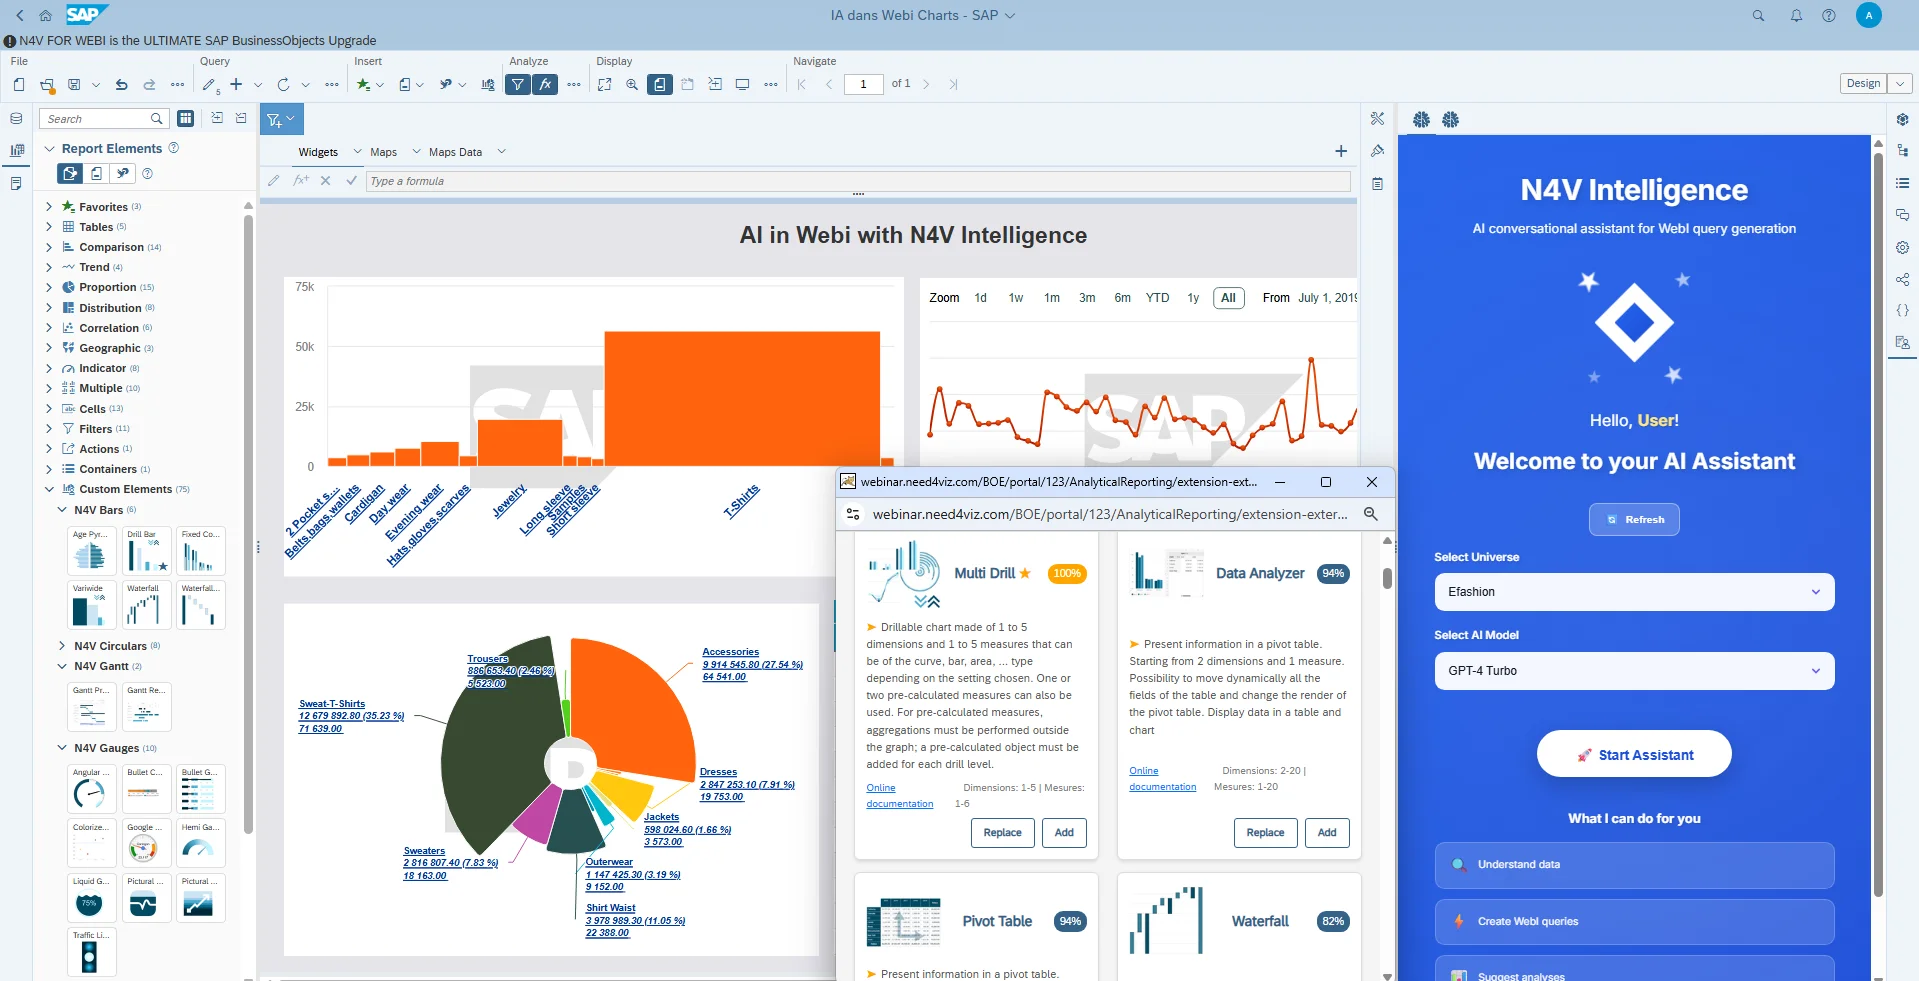
N4V FOR WEBI now integrates AI capabilities that allow users to create Webi documents through natural language queries, including voice input. The AI automatically recommends the most suitable chart types for the data and detects predictive series and trends. A revolution for BI accessibility.
Self-Service BI and the Democratization of Analysis
The self-service BI trend is accelerating: the goal is to empower business users to create their own reports and analyses without depending on IT teams. This democratization is enabled by intuitive interfaces, intelligent assistants and ready-to-use visual components.
Within the SAP ecosystem, N4V FOR WEBI perfectly embodies this approach: Webi users access a catalog of over 60 chart components directly in their familiar interface, without writing a single line of code. N4V’s Data Analyzer even allows complex analyses to be performed without leaving Webi, eliminating dependency on Excel or third-party tools.
Mobile BI and the Cloud
Mobile access to data is no longer a luxury but a necessity. Decision-makers expect to view their dashboards from a tablet or smartphone, wherever they are. Cloud migration is also accelerating, offering flexibility, scalability and reduced infrastructure costs.
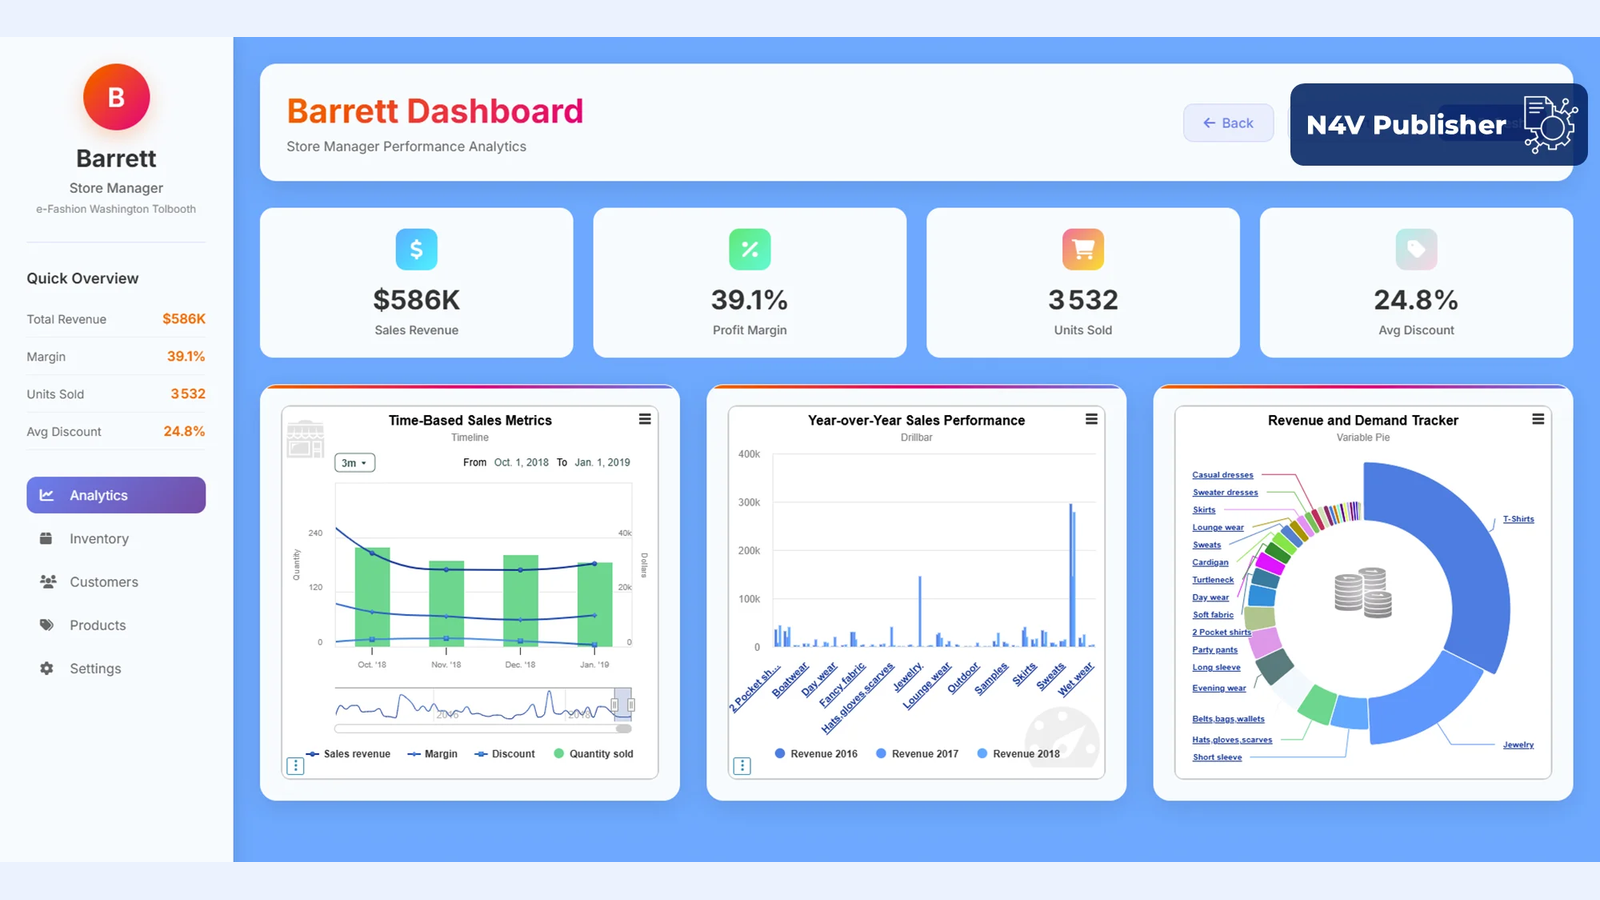
N4V FOR WEBI meets these requirements with responsive components accessible from any browser, deployment available in both Cloud and on-premise, and dynamic HTML export that enables publishing interactive dashboards on any website or intranet, without additional SAP BO licenses for viewers.
DataViz for Accessibility and Compliance
European web accessibility directives (WCAG, European Web Accessibility Directive) require public organizations and, increasingly, private companies to make their digital content accessible to all. BI and DataViz are no exception.
N4V FOR WEBI addresses this requirement by providing components compatible with accessibility standards, enabling organizations to publish charts compliant with European directives. A decisive advantage for public sector organizations and companies committed to CSR.
6. Making Your BI Project a Success: Best Practices
Define a Clear Vision
Before choosing tools, it is essential to define the objectives of the BI initiative. What are the priority KPIs? Who are the target users? Which decision-making processes need improvement? A successful BI project always starts with a business needs analysis.
Build on Existing Foundations
Rather than starting from scratch, the most effective organizations build on their existing infrastructure. In the SAP ecosystem, this means making the most of universes, queries and security models already in place in BusinessObjects, while enriching them with modern visualization and interactivity capabilities.
The N4V Advantage: Modernize Without Replacing
N4V FOR WEBI installs on an existing SAP BusinessObjects platform in just a few clicks, with no new infrastructure, no data migration and no extensive training. Existing reports and universes are preserved, security models respected. It is an incremental, fast and cost-effective modernization.
Involve Users from the Start
Adoption is the key to success. Involving business users from the design phase, gathering their requirements, training them and supporting them in learning the tools are all decisive factors. A powerful tool that goes unused has no value.
Measure and Iterate
A BI project is never finished. It must evolve with the organization’s needs, technological developments and user feedback. Setting up adoption and satisfaction tracking indicators enables continuous improvement.
7. BI, Big Data and Advanced Analytics: What Are the Differences?
The terms Business Intelligence, Big Data and Advanced Analytics are often confused. While they share a common goal — extracting value from data — they differ in scope, methods and use cases.
| Business Intelligence | Big Data | Advanced Analytics | |
|---|---|---|---|
| Objective | Understand the past and present | Process massive volumes | Predict and prescribe |
| Data | Structured (databases, ERP, CRM) | Structured + unstructured | All sources |
| Users | Decision-makers, managers, business | Data engineers, architects | Data scientists |
| Typical Tools | SAP BO, Webi, N4V FOR WEBI | Hadoop, Spark, data lakes | Python, R, TensorFlow |
| Output | Dashboards, reports | Storage and processing at scale | Predictive models |
| Complementarity | Consumes Big Data outputs | Feeds BI with data | Enriches BI with predictive capabilities |
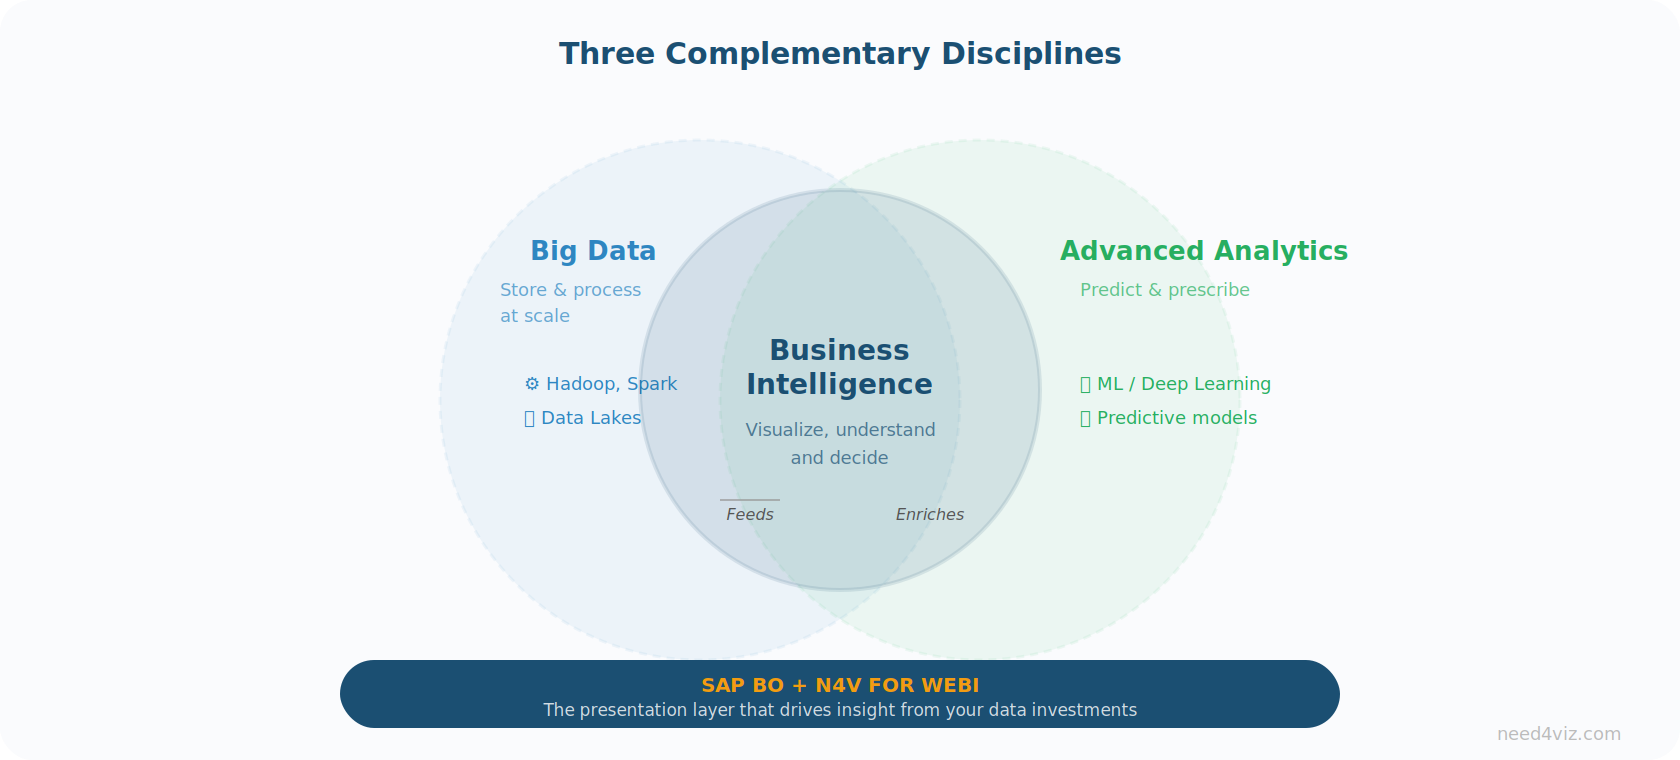
These three domains are fundamentally complementary. Big Data provides storage and processing capabilities, advanced analytics delivers predictive models, and BI presents them as understandable, actionable visualizations for decision-makers. It is this final step — presentation and sharing — that gives full meaning to data investments.
8. Why SAP BusinessObjects and N4V FOR WEBI?
SAP BusinessObjects: A Proven Foundation
SAP BusinessObjects is one of the most widely deployed BI suites in the world, particularly in large enterprises and the public sector. Its semantic layer (universes), query engine (Web Intelligence), security model and scheduling capabilities make it a robust and sustainable platform. With the release of SAP BI 2025, SAP reaffirms its commitment to this platform with new features for Web Intelligence and the semantic layer.
N4V FOR WEBI: Propelling Webi into Modern BI
N4V FOR WEBI is the leading solution for extending SAP Web Intelligence capabilities. Developed by Need4Viz, the only software vendor exclusively focused on SAP BusinessObjects, it transforms Webi into a full-fledged DataViz and dashboarding platform without disrupting existing infrastructure.
visualization components
Charts, gauges, maps, tables, KPIs, timelines…
lines of code required
Native integration, click-to-configure
dynamic export
Web publishing without additional BO licenses
Key Differentiators
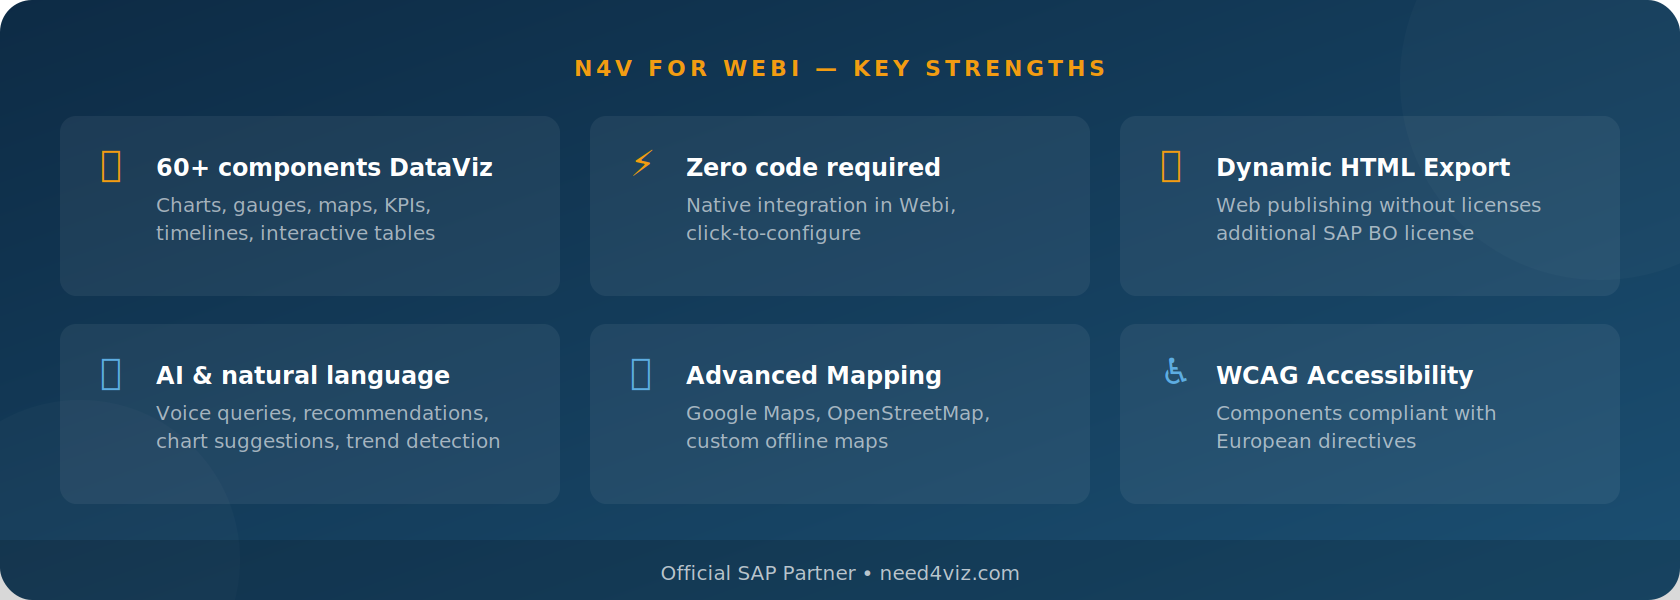
Native Integration — N4V FOR WEBI integrates directly into the SAP Web Intelligence interface. Users don’t need to switch tools or learn new software.
No Data Duplication — All data stays within the existing SAP BusinessObjects environment. Security and governance are preserved.
Advanced Mapping — Integration with Google Maps and OpenStreetMap online, or custom offline maps for complete control of your geographic visualizations.
Built-in AI — Natural language queries, voice input, chart recommendations and trend detection directly within Webi.
Universal Distribution — Export dashboards as interactive HTML for publication on intranet, extranet or websites, without SAP BO licenses for viewers.
Accessibility — Components compliant with European web accessibility directives (WCAG).
SAP Partner — Need4Viz is an official SAP partner, ensuring quality, security and certified integration with the SAP BusinessObjects platform.
Conclusion
Business Intelligence is no longer a competitive advantage reserved for large enterprises: it is a necessity for any organization that wants to manage performance, make informed decisions and align teams around a shared data vision.
The convergence of BI, Data Visualization and artificial intelligence opens up considerable opportunities. Organizations that capitalize on these developments — by building on solid foundations and the right tools — will be best equipped to navigate an ever-changing economic environment.
With SAP BusinessObjects and N4V FOR WEBI, organizations have a unique combination: the robustness of a proven BI platform and the modernity of a cutting-edge DataViz solution. All without disruption, migration or additional complexity.
Discover how N4V FOR WEBI can transform your SAP BusinessObjects experience
Request a personalized demo and see how to turn your Webi reports into true management tools.
SAP, SAP BusinessObjects and Web Intelligence are registered trademarks of SAP SE. N4V FOR WEBI is a trademark of Need4Viz.
Sources
- Mordor Intelligence — Business Intelligence Market Size, Growth & Industry Trends (2025-2030) — BI market estimated at $38.15B in 2025, 8.17% CAGR.
- Fortune Business Insights — Business Intelligence Market Size & Share (2025-2032) — BI market estimated at $34.82B in 2025, 8.9% CAGR.
- Straits Research — Business Intelligence Market Size & Outlook (2025-2033) — BI market estimated at $36.82B in 2025. BI adoption > 80% in enterprises with 5,000+ employees (360Suite BI Survey).
- Precedence Research — Business Intelligence Market Size (2025-2034) — BI market estimated at $33.62B in 2025, 7.26% CAGR.
- Erik Brynjolfsson, Lorin Hitt & Heekyung Kim — “Strength in Numbers: How Does Data-Driven Decision Making Affect Firm Performance?” — MIT/Wharton study of 179 large publicly-traded firms: data-driven organizations are approximately 5% more productive and profitable.
- MIT Sloan Management Review — Lessons from Becoming a Data-Driven Organization — Case studies on data-driven transformation (Intermountain Healthcare, Nedbank, GE, Amsterdam).
- Grand View Research — Business Intelligence Software Market Size Report (2024-2030) — Cloud BI segment at 52.5% in 2023, BI software market at $36.6B in 2023.
- Need4Viz — N4V FOR WEBI, the comprehensive solution for SAP BusinessObjects — 60+ visualization components, mapping, AI, HTML export.
👉 Discover Need4Viz and what we really bring to SAP Web Intelligence
Need4Viz extends SAP Web Intelligence with advanced dataviz, interactivity, automation and AI capabilities to transform your reports into real decision-making tools.
Discover Need4Viz