


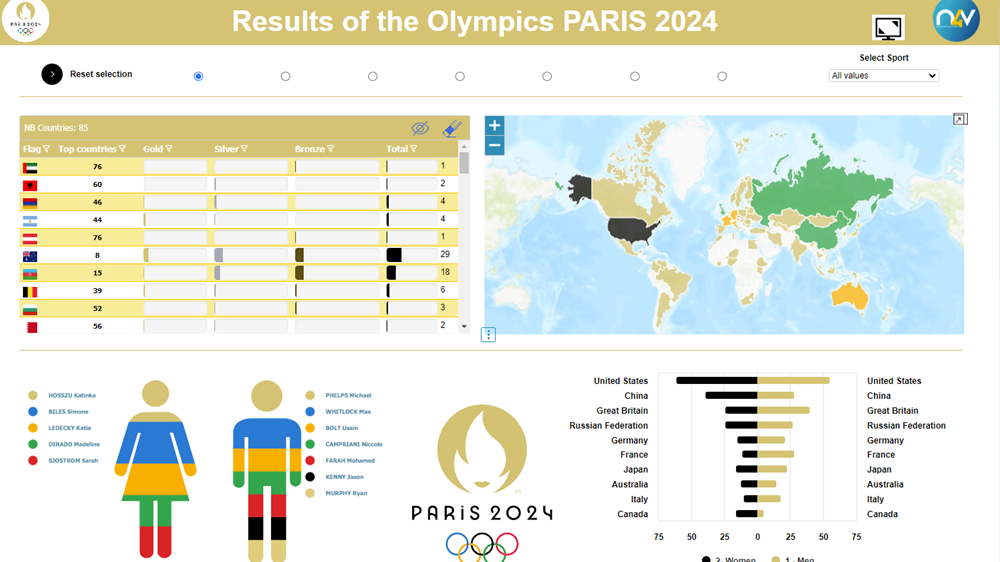
SAP Web Intelligence is the most widely deployed reporting tool in the SAP ecosystem — and one of the most under-extended. After a decade without major visualization updates, WebI alone can no longer meet modern dashboard expectations: no interactive charts, no KPI tiles, no geographic maps, no HTML5 publishing without additional SAP licenses.
This guide covers the 7 most critical limitations of native SAP Web Intelligence — and shows exactly how N4V FOR WEBI solves each one, without migration, without rebuilding your universes, and without retraining your teams.
Organizations like McKesson, Banque de France, Chantiers de l’Atlantique, and the University of Queensland chose this path to modernize SAP BO dashboards while preserving 100% of their existing investment.
Practical guide for BI managers and CIOs
Introduction
SAP Web Intelligence remains a cornerstone of enterprise business intelligence. Reliable, well-mastered by teams, and integrated into a rich semantic layer, it has no equivalent within the SAP ecosystem for operational reporting. Yet its visualization capabilities have barely evolved over the past decade.
Meanwhile, business users have been exposed to modern interfaces — interactive dashboards, drill-down charts, embedded maps — and now expect the same level of sophistication in their BO reports.
« SAP doesn’t invest in certain areas precisely because Need4Viz already does it excellently. » — Eric Fenollosa, Head of Analytics Product Management, SAP
This article identifies the 7 most frequently cited limitations by BI managers we meet, and shows how N4V FOR WEBI addresses each one concretely — without migration, without a new product, and without heavy training.
The 7 Limitations of Native WebI
1. A Frozen Chart Catalog
WebI offers around twenty chart types. That’s sufficient for basic reporting, but far below what modern tools provide. No interactive gauges, no treemaps, no advanced bubble charts, no KPI tiles.
With N4V FOR WEBI, you get access to more than 60 interactive components — waterfall charts, combinable charts (MultiChart), speedometer-style gauges, modern KPI tiles — all configurable without code.
N4V Widgets — 60+ interactive visualization components integrated into SAP Web Intelligence
2. No Integrated Mapping
WebI lets you color a static map. That’s it. No zoom, no geographic drill-down, no data projection onto real map backgrounds.
N4V FOR WEBI embeds a true GIS (Geographic Information System) with Google Maps, OpenStreetMap, drillable choropleth maps (region → department → municipality), and the ability to overlay charts directly on the map.

N4V Maps — Google Maps cartography natively integrated into SAP Web Intelligence
3. Limited Interactivity Between Components
Classic WebI 4.3 offers element links and input controls (filters) to create interactivity. But these remain external to the report itself, and no chart is drillable.
N4V FOR WEBI brings built-in navigation components directly into reports — drillbars, visual filters, time sliders — as well as drillable charts: click on a segment to drill down into detail, dynamically filter other components on the page, and transform a static report into a true interactive dashboard.

N4V FOR WEBI — Interactive dashboard with cross-component filtering
4. No Native Web Distribution
To share a WebI report, you must either grant access to BO Launch Pad (and a license), or export to PDF — a format that loses all interactivity.
N4V Publisher exports your reports as interactive HTML5, viewable in any browser, embeddable on an intranet or website, with no additional SAP license. Data stays fresh and charts remain interactive.
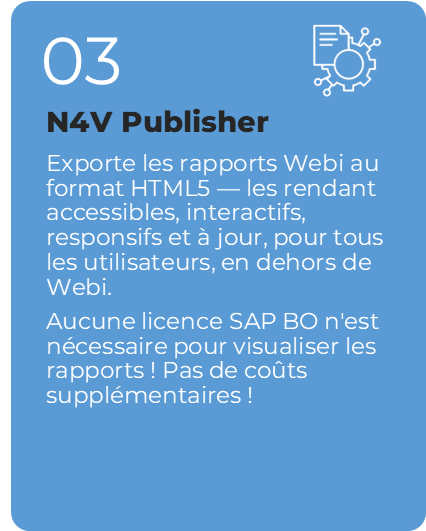
N4V Publisher — Responsive HTML5 export, accessible without a SAP BO license
5. No On-the-Fly Chart Type Switching
In WebI, the chart type is fixed by the designer. End users cannot switch from a bar chart to a pie chart to explore the same data differently.
N4V’s MultiGraph component lets users switch between visualization types in a single click, directly in view mode.
6. No AI Assistance for Report Creation
Building a WebI report requires knowledge of universes, dimensions, and measures. This is a major barrier to self-service BI.
N4V Intelligence allows users to ask a question in natural language — “Give me revenue by region over the last 12 months” — and automatically generates the corresponding WebI report, with a suggestion for the best visualization type.
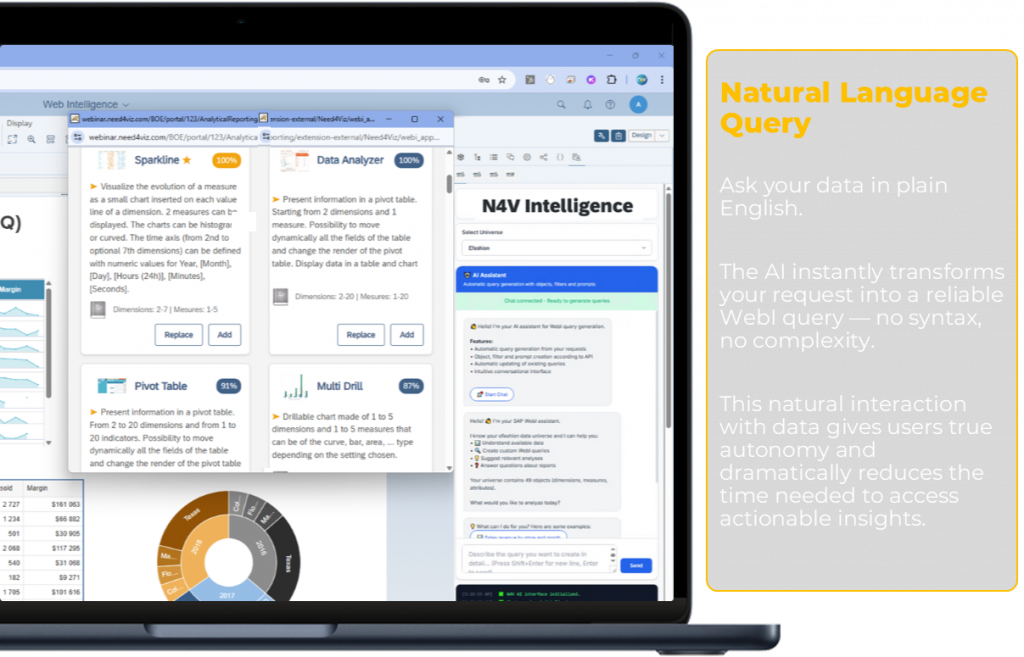
N4V Intelligence — Natural language queries and chart recommendations in SAP Web Intelligence
7. Outdated Design, Lack of Modernity
Native WebI reports have a dated visual look. Colors, fonts, and ergonomics no longer match current data visualization standards.
N4V components adopt a modern design, smooth animations, customizable color palettes, and produce reports your users will be proud to present in executive committee meetings.
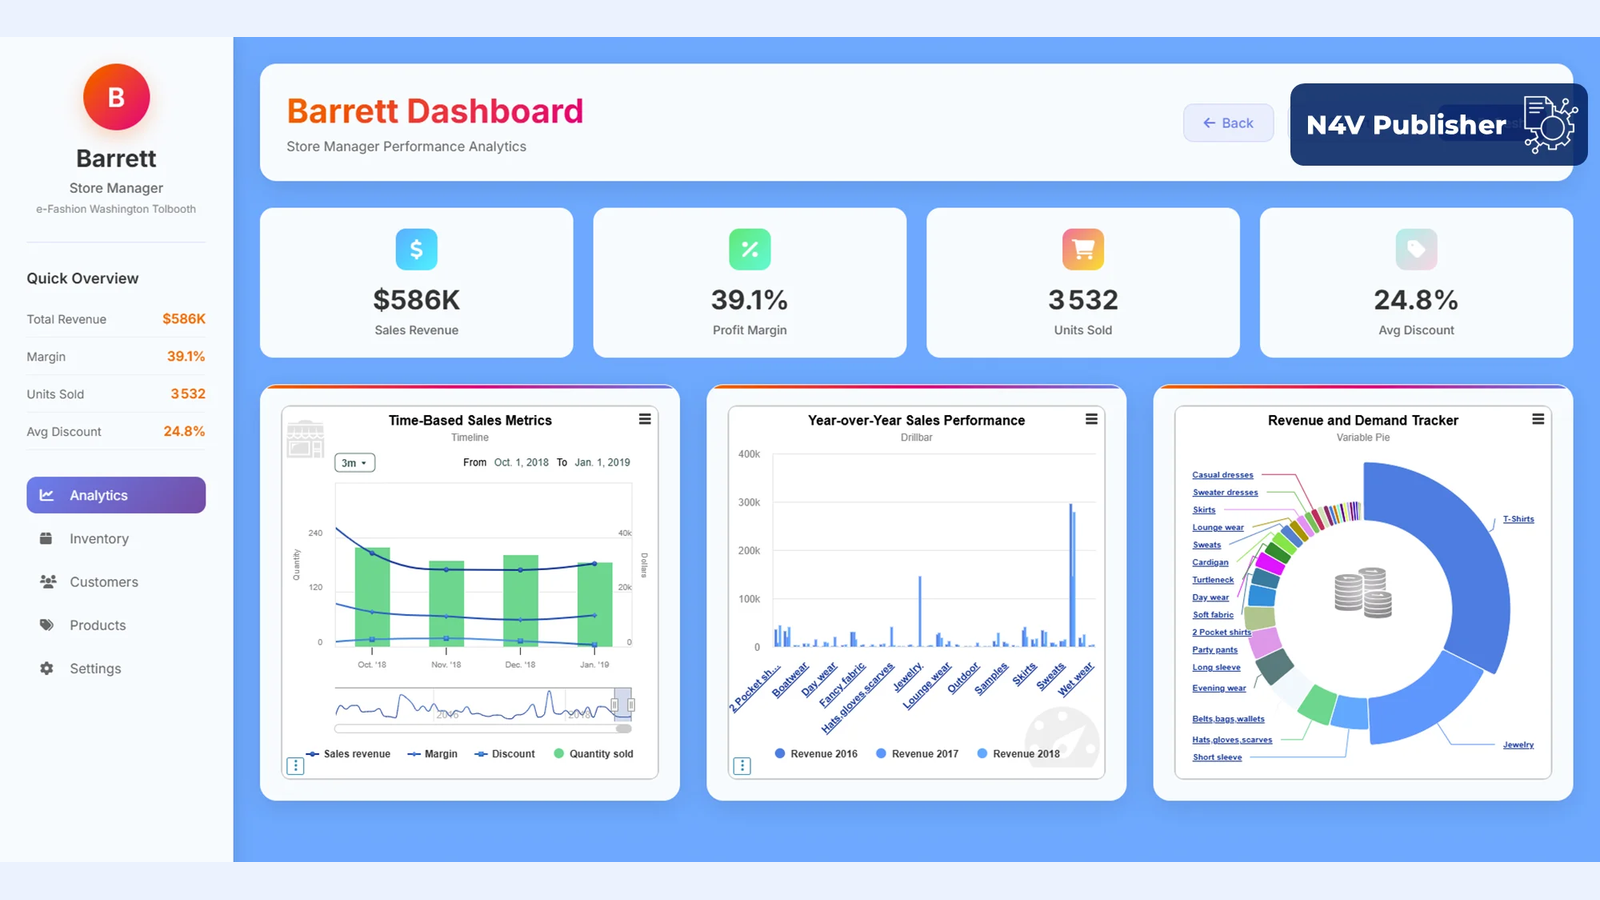
N4V FOR WEBI — Manager Dashboard with a modern and professional design
Comparison Table
Overview of native WebI vs. WebI + N4V FOR WEBI capabilities:
A Risk-Free Deployment
N4V FOR WEBI installs in minutes on your existing SAP BO environment. There is no modification to your universes, no report migration, no code to write. Your teams keep their habits and immediately gain new capabilities.
The solution is available in cloud or on-premise mode, and the Need4Viz team, based in Paris and Miami, provides responsive support with a response time under 24 hours.
Frequently Asked Questions
What are the main limitations of SAP Web Intelligence for modern dashboards?
SAP Web Intelligence has seven critical limitations for modern dashboard use: a frozen chart catalog of around 20 types, no integrated GIS mapping, limited cross-component interactivity, no native HTML5 publishing without additional SAP licenses, no KPI tile or gauge components, no AI-powered natural language queries, and a static document design model that prevents real-time dashboard behavior. These limitations are addressed by N4V FOR WEBI, which adds a complete visualization and dashboard layer directly inside WebI.
Can SAP Web Intelligence be extended without migrating to SAP Analytics Cloud?
Yes. N4V FOR WEBI extends SAP Web Intelligence with advanced dashboarding capabilities — 60+ interactive chart types, GIS mapping, HTML5 publishing, and AI-powered queries — all installed directly on your existing SAP BusinessObjects server. No migration to SAP Analytics Cloud or Power BI is required. Existing universes, reports, user permissions, and data connections remain fully intact.
Why hasn’t SAP improved WebI visualization capabilities natively?
SAP’s product strategy focuses WebI investment on core reporting, governance, and SAP ecosystem integration. As Eric Fenollosa, Head of Analytics Product Management at SAP, stated publicly: “SAP doesn’t invest in certain areas precisely because Need4Viz already does it excellently.” N4V FOR WEBI fills the visualization gap as a recognized SAP Silver Partner solution, purpose-built for Web Intelligence extension.
How does N4V FOR WEBI solve the interactivity limitations of WebI?
N4V FOR WEBI replaces WebI’s basic input controls with a full cross-component interactivity layer. Clicking a chart segment dynamically filters all other components on the same page. Drillbars, visual filters, time sliders, and MultiChart components turn static WebI documents into interactive dashboards — without any custom development or scripting.
Is N4V FOR WEBI compatible with SAP BusinessObjects BI 4.2, BI 4.3, and SAP BI 2025?
Yes. N4V FOR WEBI is compatible with SAP BusinessObjects BI 4.2, BI 4.3, and the latest SAP BI 2025 release. It supports both UNV and UNX universe types, and works with all standard WebI data connections. The solution is certified by SAP and available through the SAP partner ecosystem.
Discover Need4Viz and what we truly bring to SAP Web Intelligence
Need4Viz extends SAP Web Intelligence with advanced dataviz, interactivity, automation, and AI capabilities to transform your reports into real decision-support tools.
Discover Need4Viz | Request a Demo
👉 Discover Need4Viz and what we really bring to SAP Web Intelligence
Need4Viz extends SAP Web Intelligence with advanced dataviz, interactivity, automation and AI capabilities to transform your reports into real decision-making tools.
Discover Need4Viz