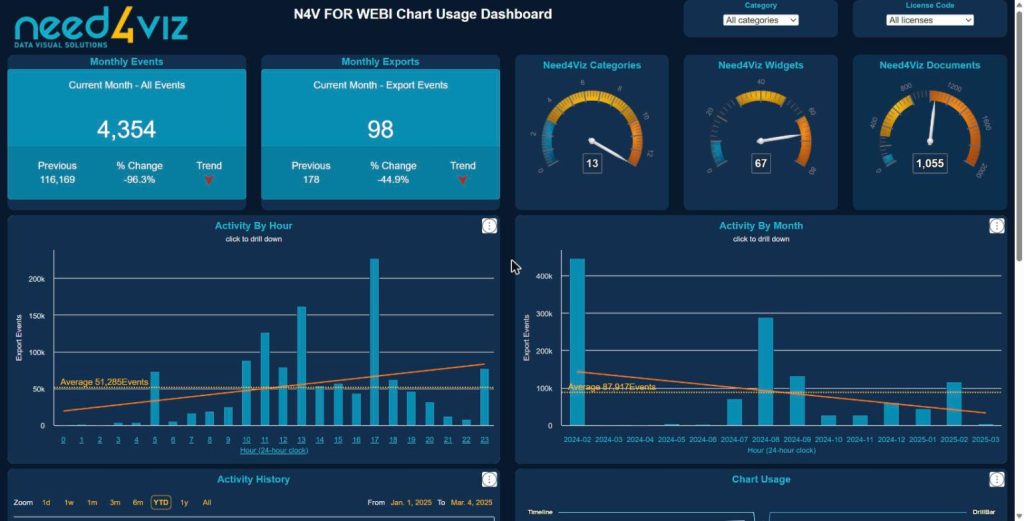
← All demos › IT & BI administration IT — Platform usage statistics Full screen New tab Open the dashboard Who uses which report, how often, and on which device. Useful before a migration or a licence review. N4V modules used N4V Publisher N4V Widgets Sector IT & BI administration Licence needed to view None — the dashboard is plain HTML5. Request a demo on your data Other demos Non-profit & associations NGO — Donation analysis Track donation volumes, donor retention and campaign performance for a non-profit. Built from a single Web Intelligence report and published to HTML5. N4V Publisher N4V Widgets Retail & distribution Sales — Commercial performance over time Revenue, margin and volume followed year after year, with filters by period and territory and a mapping tab. Everything comes from one Web Intelligence… N4V Maps N4V Publisher N4V Widgets Retail & distribution Retail — Daily revenue overview Daily sales, margin and basket analysis across a store network, with interactive filters kept from the original Webi report. N4V Publisher N4V Widgets ← All demos
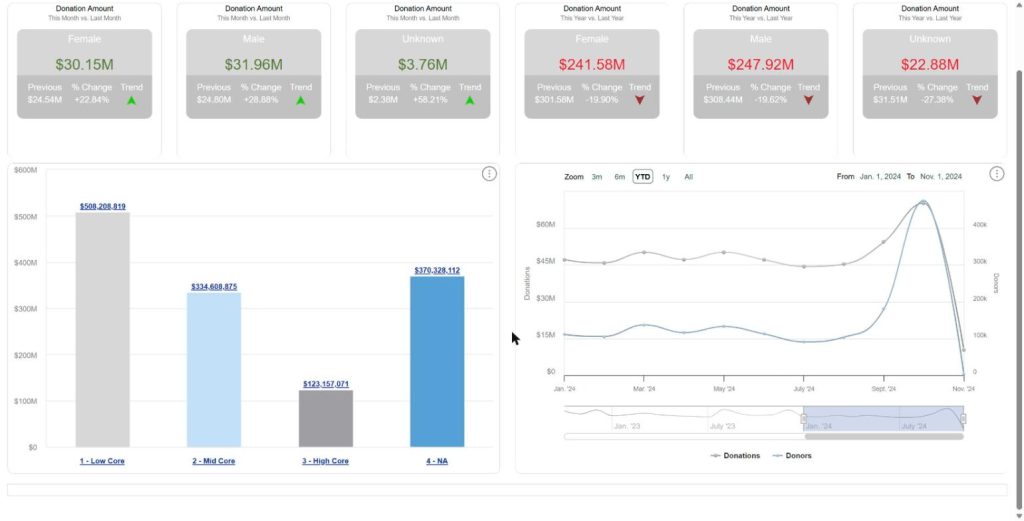
Non-profit & associations NGO — Donation analysis Track donation volumes, donor retention and campaign performance for a non-profit. Built from a single Web Intelligence report and published to HTML5. N4V Publisher N4V Widgets
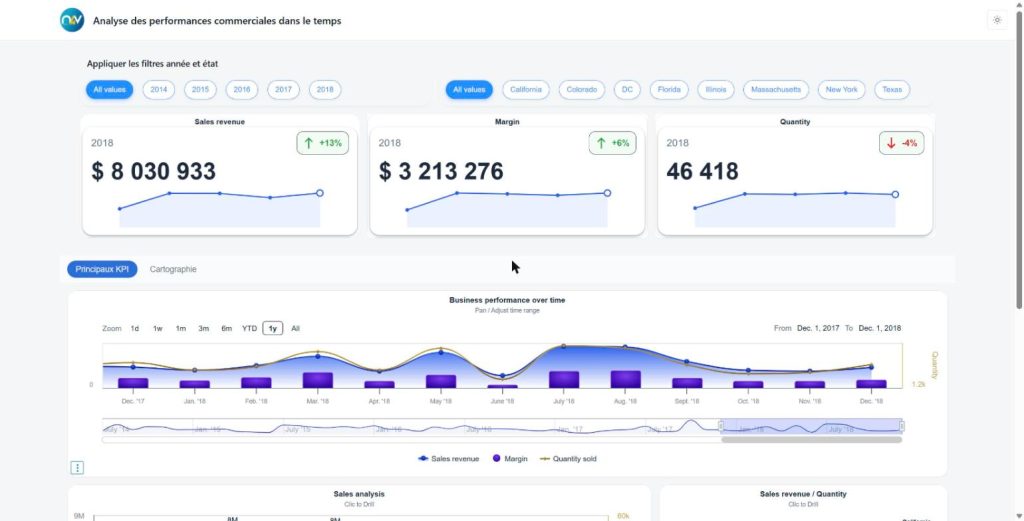
Retail & distribution Sales — Commercial performance over time Revenue, margin and volume followed year after year, with filters by period and territory and a mapping tab. Everything comes from one Web Intelligence… N4V Maps N4V Publisher N4V Widgets
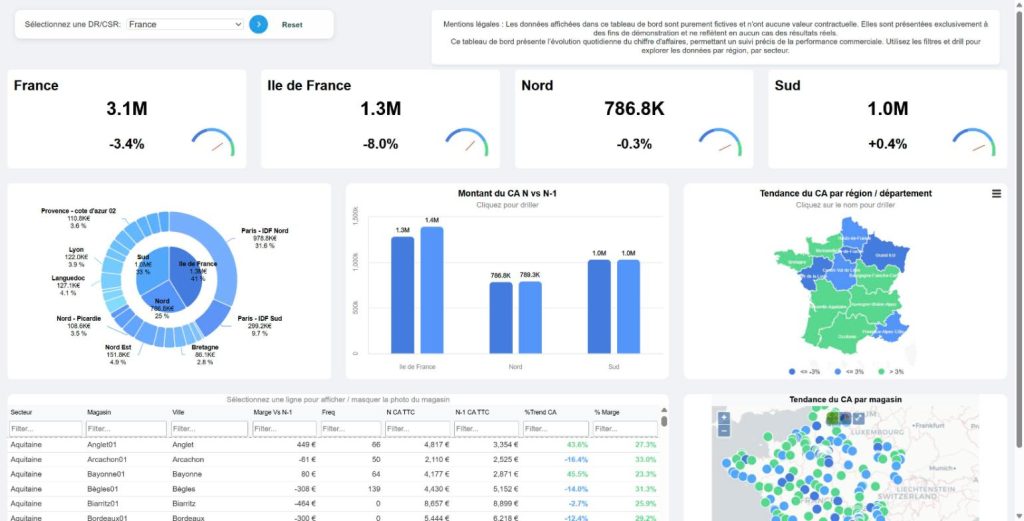
Retail & distribution Retail — Daily revenue overview Daily sales, margin and basket analysis across a store network, with interactive filters kept from the original Webi report. N4V Publisher N4V Widgets