


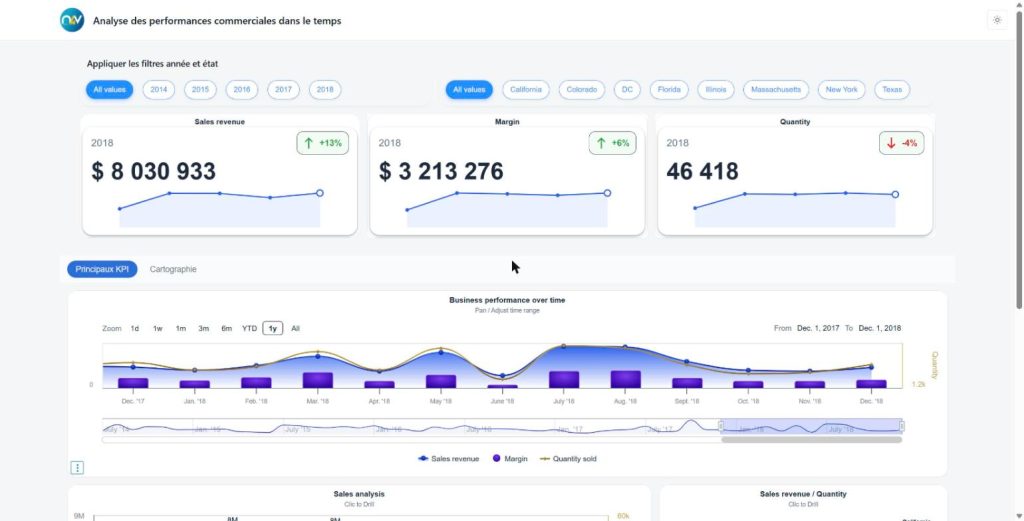
Revenue, margin and volume followed year after year, with filters by period and territory and a mapping tab. Everything comes from one Web Intelligence report.
Other demos
Retail & distribution
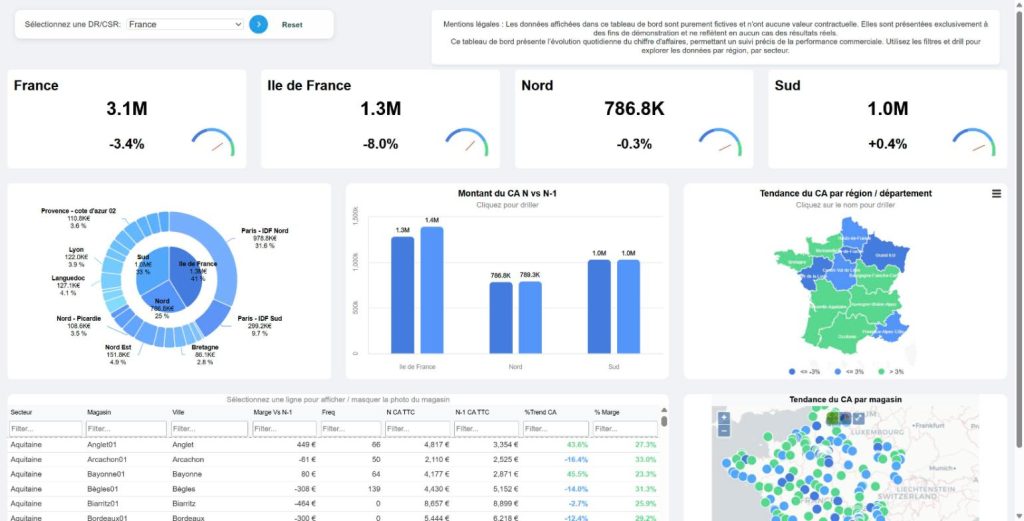
Retail — Daily revenue overview
Daily sales, margin and basket analysis across a store network, with interactive filters kept from the original Webi report.
N4V Publisher
N4V Widgets
Retail & distribution
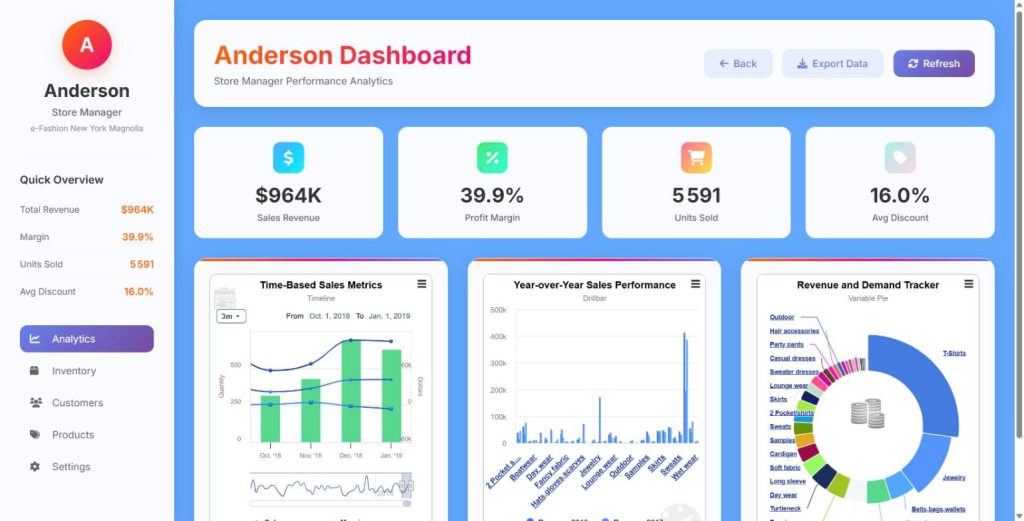
Retail — Store manager scorecard
A personalised scorecard per store manager: targets, achievement and ranking, distributed without an additional SAP BusinessObjects licence.
N4V Publisher
Non-profit & associations
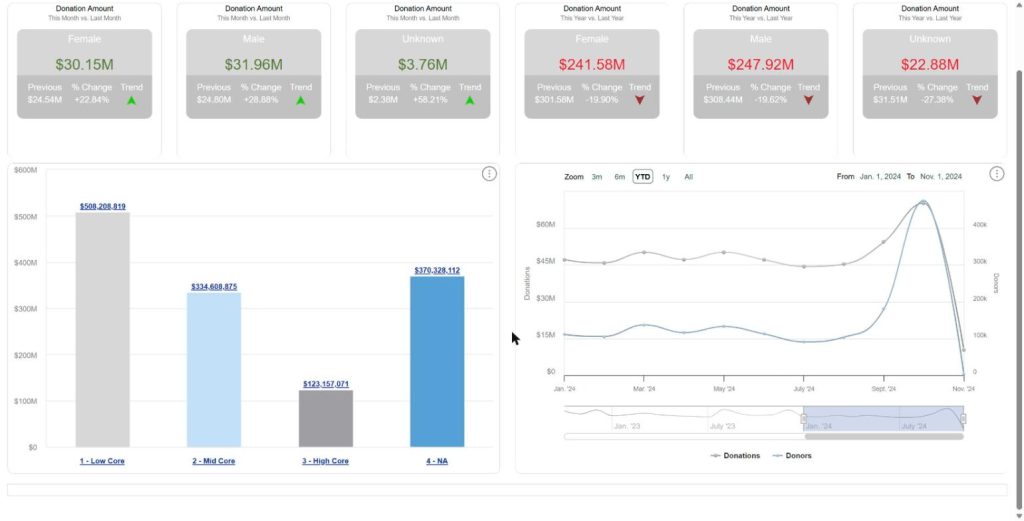
NGO — Donation analysis
Track donation volumes, donor retention and campaign performance for a non-profit. Built from a single Web Intelligence report and published to HTML5.
N4V Publisher
N4V Widgets