Chart recommender
Always the right widget recommendation with this 1st AI module integrated in Webi
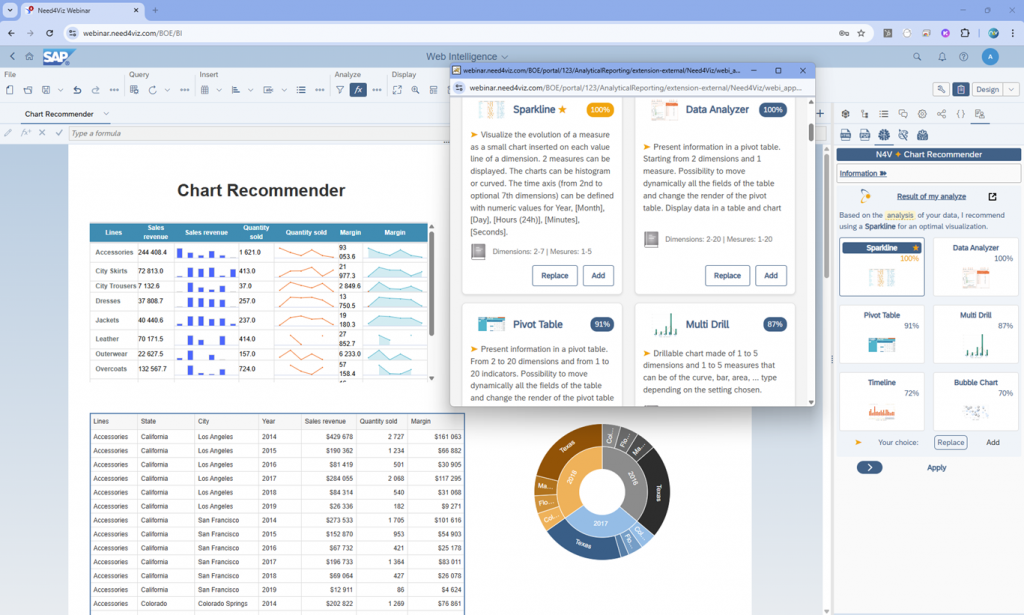
The Chart Recommender arrives in the N4V Panel. This intelligent assistant 1st module in the N4V Intelligence offering, analyses your selected data and automatically suggests the most relevant visualization. Save time, simplify your choices and make sure you always have the right chart at your fingertips.
Customize WebI with N4V Panel
More control over Webi
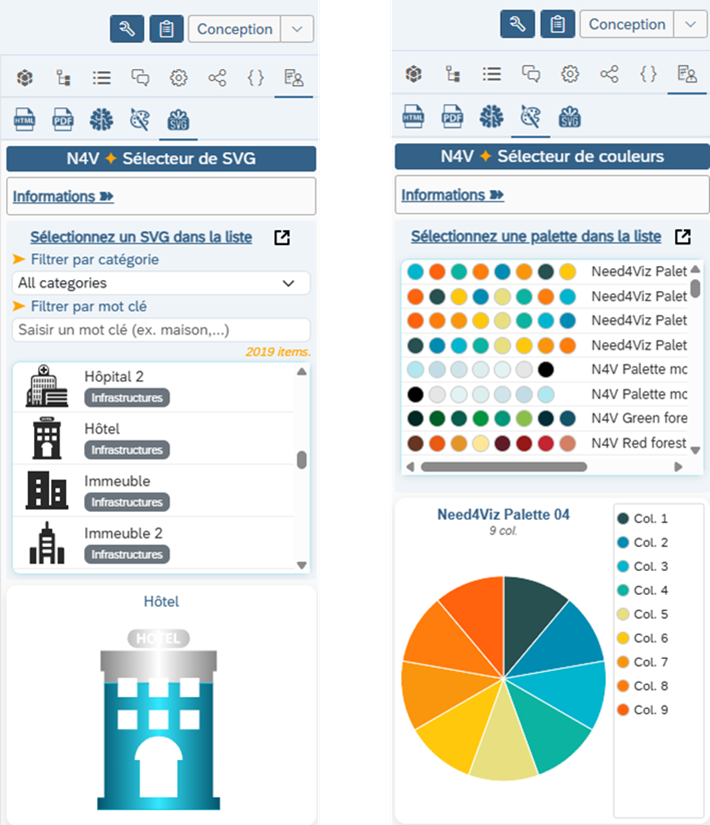
After HTML and PDF export, the WebI Designer experience becomes even more intuitive with the direct integration of an SVG icon selector (2000+) and a color palette selector (50+). Customizing your reports in WebI has never been easier.
Enhanced widgets
Evolutions for greater clarity
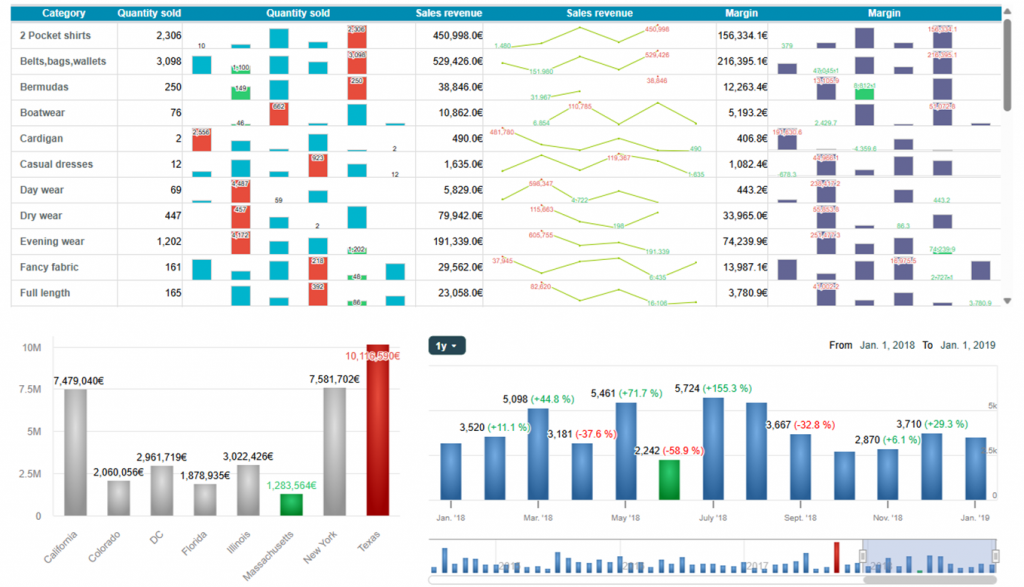
N4V widgets are more readable and intelligent, with highlighted min/max values, color-coded dimension values, an enriched Timeline with deltas and zooms, and Sparkline with smart tooltip displaying labels and key values.
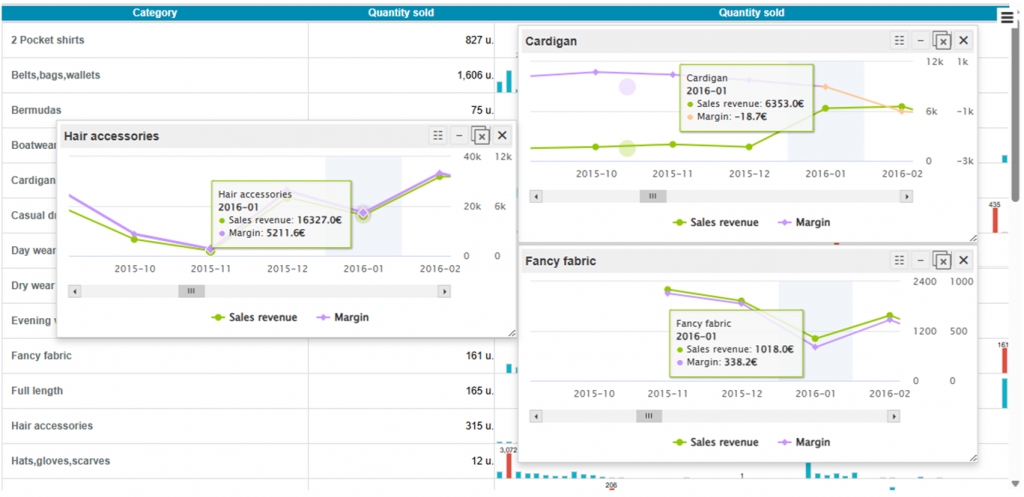
Sparkline: enhanced tooltips
A more stable and reliable version
Sparkline now displays your measurement graphs in tooltips on hover. With one click, you can pin them and let the intelligent organizer automatically arrange them on your screen, all synchronized. Detailed data analysis has never been so quick!
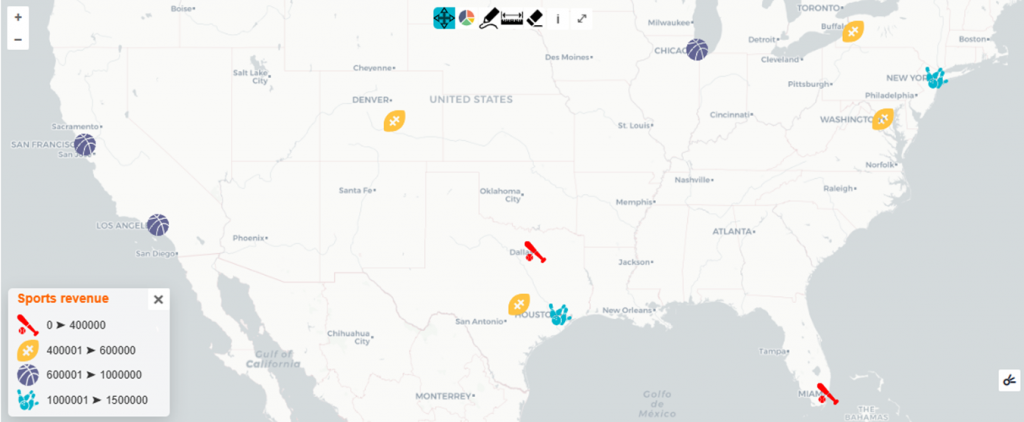
N4VOpenStreetMap: an even more powerful mapping tool
A more stable and reliable version
The OpenStreet map has been completely redesigned: more legible, more powerful, with a redesigned interactive legend. You can now use only pins, fully customizable thanks to our SVG library. Displaying your data on a map and customizing their appearance is now child’s play.
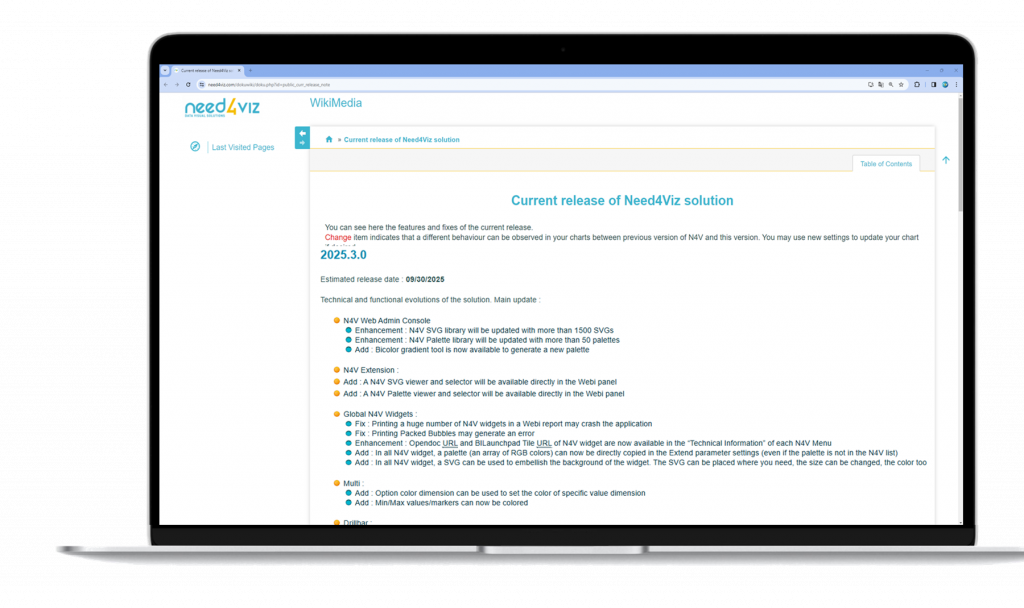
See Wiki for the full report
Note on full version 2025.3