Global new features
As usual, discover a lot of new features in your favorite N4V widgets ! More accessibility, better analyze of your data and charts…
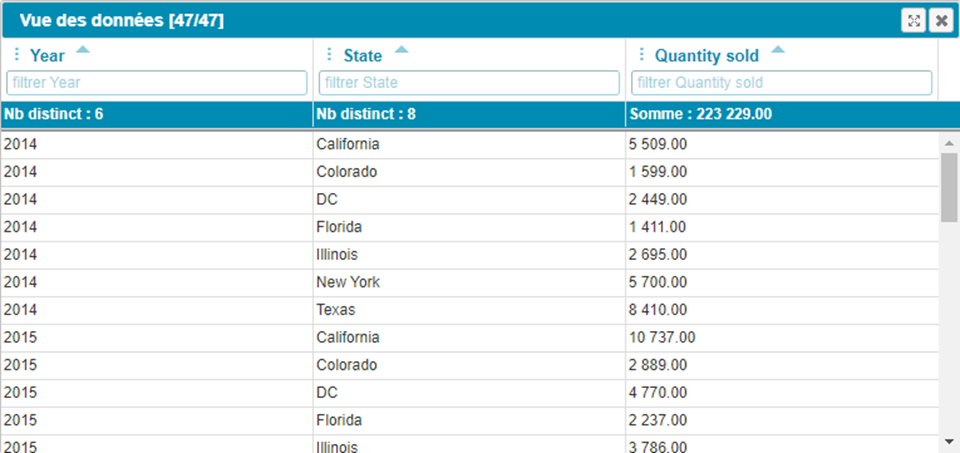
•The Data Table Viewcan now be displayed in Fullscreen mode. It has never been so easy to analyze data of your charts!
• Legend is now optionally hidable
• Your charts become more readable as never!
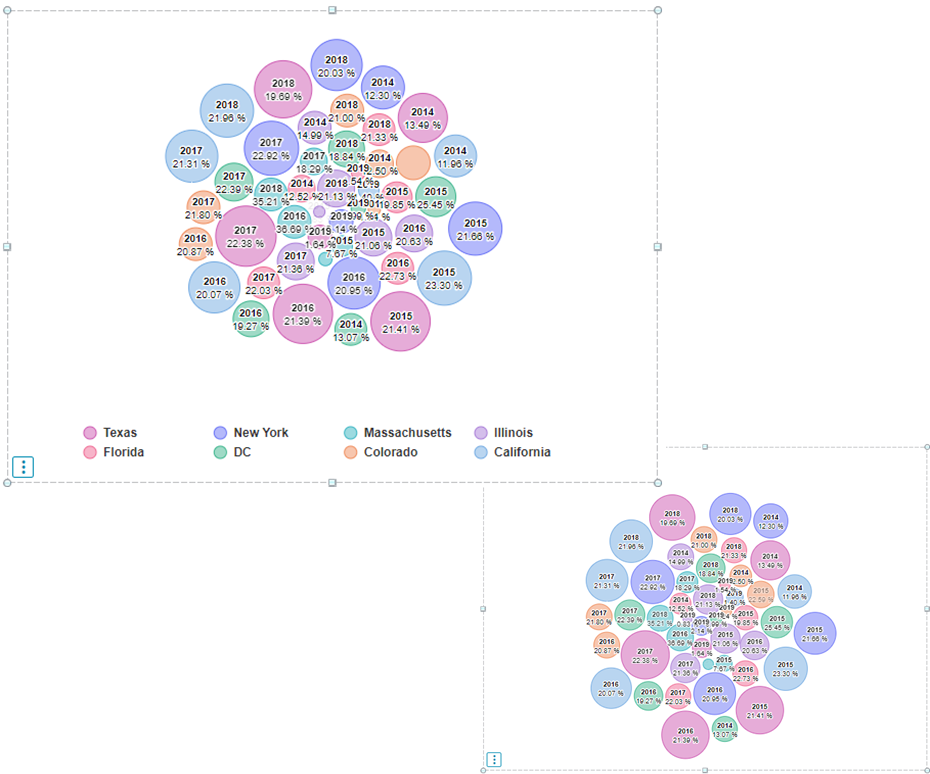
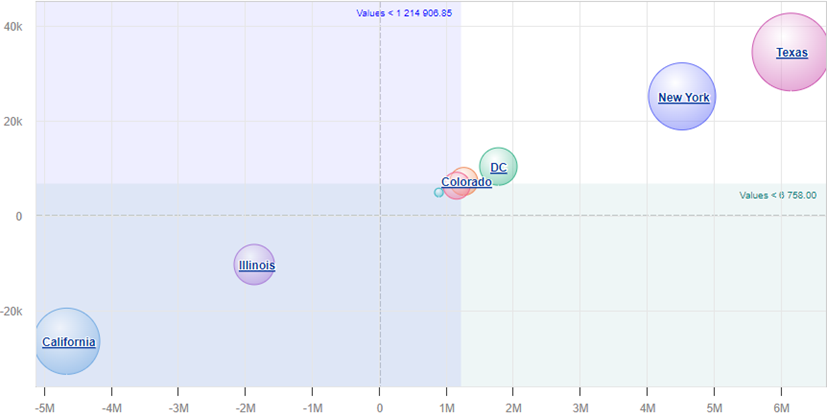
Bubble chart / Gantt
A deep enhancement has been done in many charts. Special focus on the drillable Bubble Chart and the Gantt charts…
• 3rd measure(size) is now optional
• Horizontal/Vertical dynamic(min/max/avg…) linesand ranges can be displayed
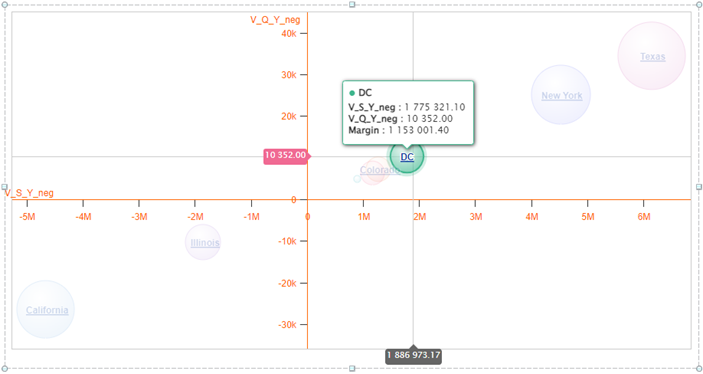
• Axes of the Bubble Chart can now be 0 centered.
• Crosshair (horizontal/vertical) can be displayed
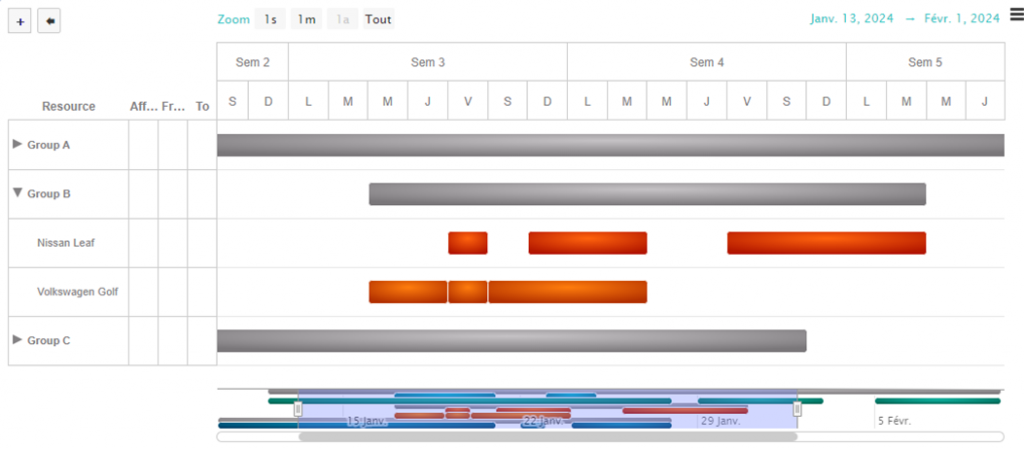
• Gantt Resources Management can now be used with grouped dimensions (fold/unfold rows).
Affectation columnscan be hidden on the fly…
Write Back Data with the Data Analyzer
From this version, it is possible to write back data from Webi to a CSV file and then integrate it where you need !!
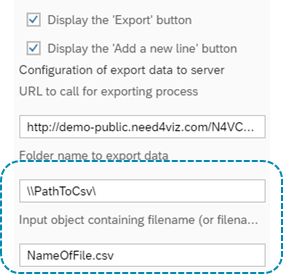
1 – Configure the Data Analyzer to enable the write back data
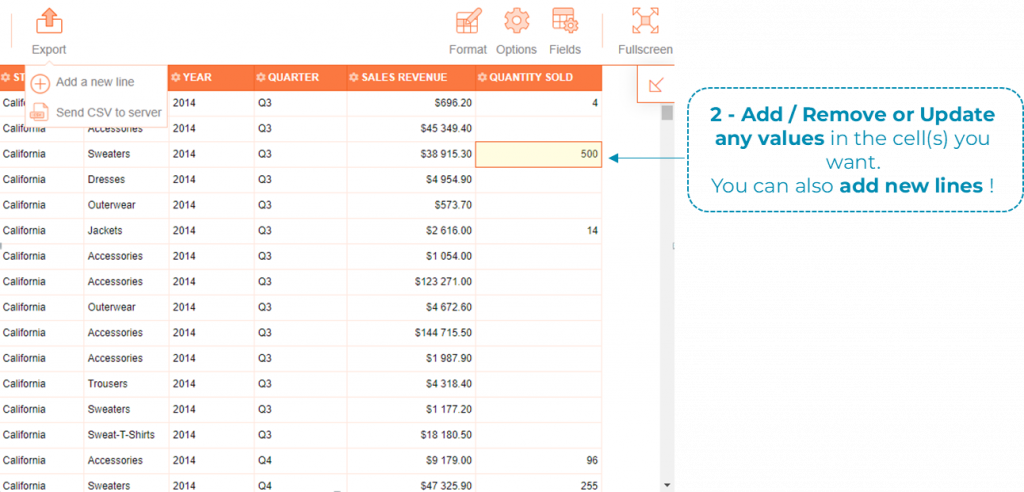
2 – Add / Remove or Update any values in the cell(s) you want.
You can also add new lines !
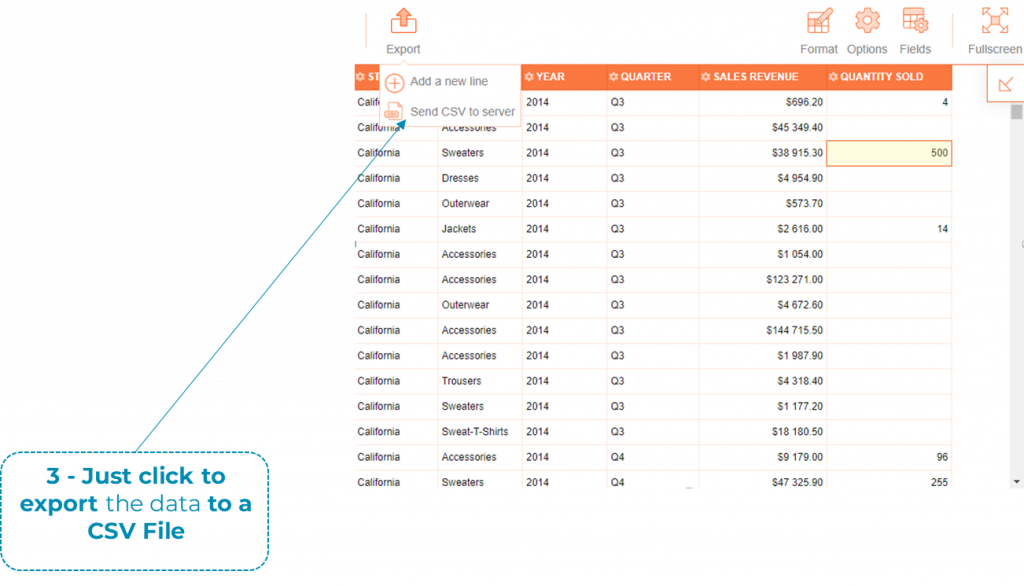
3 – Just click to export the data to a CSV File
4– The CSV is saved at the specified path and can be sent to any destinations (database included)
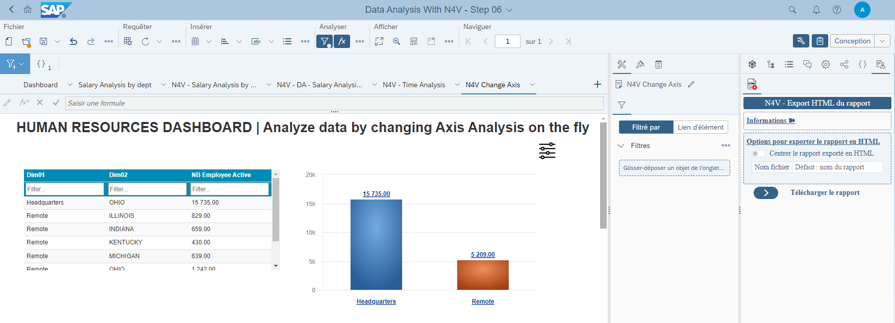
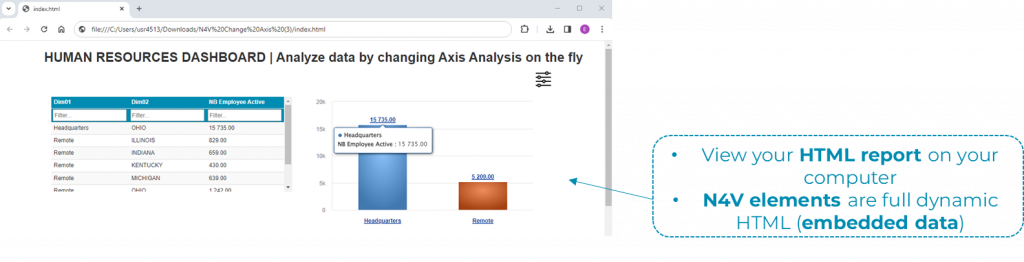
Webi Extension HTML Export
Beta version of N4V Webi Extension (for SAPBI 4.3SP3+) is provided to help you to export a one page dashboard as HTML format (embedded N4V elements in HTML format and their data).
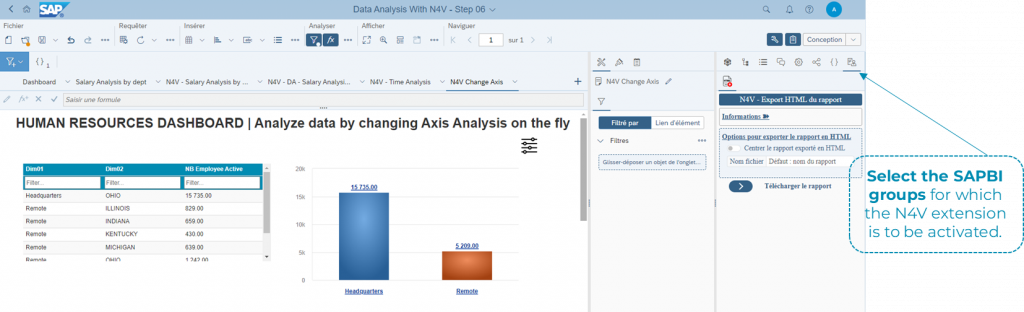
Select the SAPBI groups for which the N4V extension is to be activated.
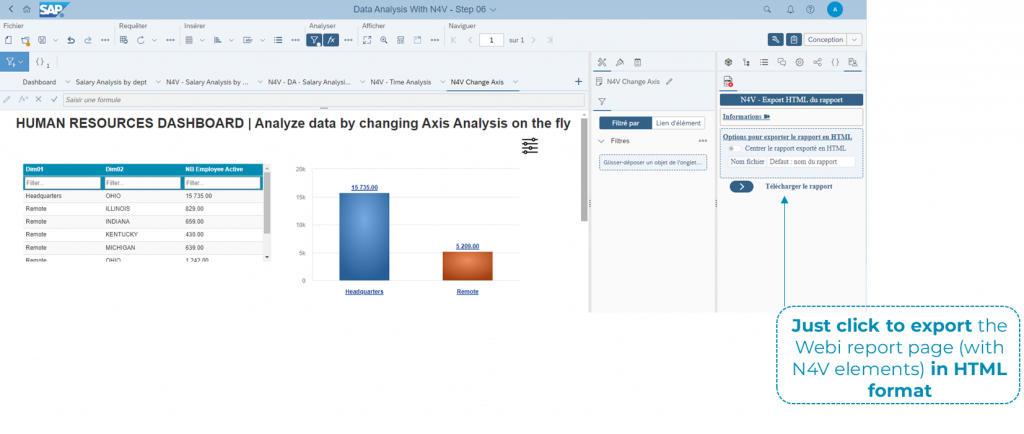
Just click to export the Webi report page (with N4V elements) in HTML format
• View your HTML report on your computer
• N4V elements are full dynamic HTML (embedded data)
See the Wiki for a full report
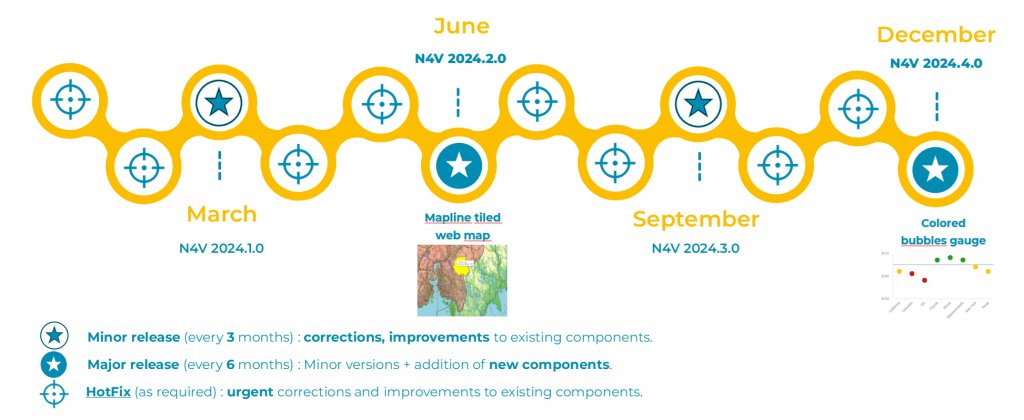
2 major releases in 2024